As out of station therefore Stock Market Outlook of today(19-03-2018) is not being updated

ॐ ह्रीं श्रीं लक्ष्मीभयो नमः॥

Correction continuation towards next supports
Intra Day Chart Analysis & Market Outlook
(16-03-2018)
Nifty-Intra Day Chart (15-Mar-2018):-
 |
| Just click on chart for its enlarged view |
1- Selling between 10407-10420
2- Selling between 10390-10405
3- Selling between 10378-10388
4- Whole day actual trading between 10347-10420
Conclusions from intra day chart analysis
As whole day continuous selling therefore on going correction continuation is expected towards yesterday mentioned next supports.
Firstly watch supports and resistances for the life of on going correction
Intra Day Chart Analysis & Market Outlook
(15-03-2018)
Nifty-Intra Day Chart (14-Mar-2018):- |
| Just click on chart for its enlarged view |
1- Down moves in Bullish Falling Channels
2- Sharp up moves in last hour
3- Whole day actual trading between 10337-10420
Conclusions from intra day chart analysis
Although corection continuation through whole day negative zone trading but intraday consolidation patterns formations also through Down moves in Bullish Falling Channels and today closing near the higher levels of the day therefore signals of some up moves towards following resistances:-
1- 10446-10478
2- 10480-10520
3- 10548-10587
Next supports of Nifty are as follows:-
1- 10314-10341
2- 10150-10205
As last 1 month US markets led violent volatility in all the Global markets therefore firstly watch above mentioned supports and resistances for the life of on going correction and firstly sustaining beyond 10314-10478 should be watched for its 1st signal.
Watch levels amid correction continuation expectations
Intra Day Chart Analysis & Market Outlook
(14-03-2018)
Nifty-Intra Day Chart (13-Mar-2018):-
 |
Just click on chart for its enlarged view
|
1- Selling between 10446-10478
2- Sharp fall
3- Lower levels supports
4- Whole day actual trading between 10378-10478
Conclusions from intra day chart analysis
Resistance between 10480-10520 was updated yesterday in "Next resistancs will confirm correction completion" and Nifty retraced from just below it at 10478.60 today and more than 3 hours selling was also seen just below it between 10446-10478 therefore yesterday mentioned resistances have become stronger today.
3 Hours consolidation between 10314-10341 yesterday and more than 3 hours selling between 10446-10478 today therefore firstly sustaining beyond 10314-10478 should be watched for sharp correction continuation below 10314 and first signal of correction completion above 10478 but correction completion which will be considered only after sustaining above 10587.
As follow up selling today was just below yesterday mentioned resistances therefore finally correction continuation is expected below 10314.
Next resistancs will confirm correction completion
Intra Day Chart Analysis & Market Outlook
(13-03-2018)
Nifty-Intra Day Chart (12-Mar-2018):-
 |
| Just click on chart for its enlarged view |
1- Consolidation between 10314-10341
2- Strong up moves in last hours
3- Whole day actual trading between 10302-10433
Conclusions from intra day chart analysis
As all the Asian markets were blasting today morning therefore gap up strong opening and 3 hours consolidation between 10314-10341 therefore this range will be immediate support of Nifty.
Next resistances between 10379-10441 was updated yesterday in "Watch Levels amid correction continuation expectations" and Nifty closed within this range today. As today sharp rally was on the back of strong global cues therefore more confirmation is required for on going correction completion which will be after sustaining above following next resistance otherwise today up moves will be understood global markets reaction only but decisive down moves will be seen only after sustaining below 10314:-
1- Resistance between 10480-10520
2- Resistance between 10548-10587
Watch Levels amid correction continuation expectations
Intra Day Chart Analysis & Market Outlook
(12-03-2018)
Nifty-Intra Day Chart (09-Mar-2018):-
 |
| Just click on chart for its enlarged view |
1- Selling between 10256-10288
2- Sharp fall in last hour
3- Whole day actual trading between 10212-10296
Conclusions from intra day chart analysis
As more than 4 hours selling therefore finally correction continuation is expected in next week.
SGX Nifty closed 136.50 points up after strong rally in US markets last Friday therefore strong opening can not be ruled out in Indian markets if as such US markets like strength remains in Asian markets also on Monday morning. As next resistances are lying between 10379-10441 also therefore expected that Nifty will not sustain above 10379.
Although expected that finally correction will remain continued below last Friday lowest but for precaution sustaining beyond 10441 should also be watched if Global markets remains extremely strong otherwise follow up selling in the beginning of next week will mean correction continuation towards and below 10000.
Correction continuation is expected towards 10000
Intra Day Chart Analysis & Market Outlook
(07-03-2018)
Nifty-Intra Day Chart (06-Mar-2018):-
 |
| Just click on chart for its enlarged view |
1- More than 4 hours seling between 10379-10441
2- Sharp fall in last hours
3- Whole day actual trading between 10216-10441
Conclusions from intra day chart analysis
As more than 4 hours seling between 10379-10441 therefore closing near lower levels of the day after sharp fall in last hours means that correction is very much on for which we are continuously from 28-01-2018.
last 18 sessions trading was between 10277-10637 and this range was broken down as well as today closing was below it therefore correction continuation is expected towards 10000.
Correction continuation expectations
Intra Day Chart Analysis & Market Outlook
(05-03-2018)
Nifty-Intra Day Chart (01-Mar-2018):-
 |
| Just click on chart for its enlarged view |
1- Down moves in Bullish Falling Channel
2- Up moves in Bearish Rising Channel
3- Down moves with selling patterns
4- Whole day actual trading between 10448-10525
Conclusions from intra day chart analysis
Although firstly Down moves in Bullish Falling Channel after positive opening but after that most time selling patterns formations therefore on going correction continuation is expected in the beginning of next week.
Bearish view
Intra Day Chart Analysis & Market Outlook
(01-03-2018)
Nifty-Intra Day Chart (28-Feb-2018):-
 |
| Just click on chart for its enlarged view |
1- Selling between 10490-10508
2- Up moves in Bearish Rising Channel
3- volatility in last hours
4- Whole day actual trading between 10462-10535
Conclusions from intra day chart analysis
As crashing like situation in all Global markets therefore huge gap down opening and intraday selling patterns formations also therefore view will be Bearish.
Good news of India replaces China as world's fastest growing economy after GDP growth at 7.2% in Q3 therefore volatility may remain high tomorrow also but until Nifty will not sustain above today highest till then decisive up moves will not be seen.
Firstly watch levels for the life of
Pull Back Rally
Pull Back Rally
Intra Day Chart Analysis & Market Outlook
(28-02-2018)
Nifty-Intra Day Chart (27-Feb-2018):-
 |
| Just click on chart for its enlarged view |
1- Sharp down in first hour
2- More than 5 hours trading with Mixed Patterns formation between 10538-10578
3- Whole day actual trading between 10538-10631
Conclusions from intra day chart analysis
Following line was told on 18-02-2018 in "Firstly watch levels for next week big moves confirmations":-
valid break out of 10399-10637 should also be watched in next week for big moves confirmations.
Importance of 10399-10637 was repeated 2 times also in previous sessions outlooks and Nifty retraced from 10631.65 today which is first signal of previous week started Pull Back Rally completion.
As more than 5 hours trading with Mixed Patterns formation between 10538-10578 today therefore firstly sustaining it beyond should be watched in the coming sessions for the life of Pull Back Rally.
Pull Back Rally continuation towards next resistances
Intra Day Chart Analysis & Market Outlook
(27-02-2018)
Nifty-Intra Day Chart (26-Feb-2018):-
 |
| Just click on chart for its enlarged view |
1- Up moves with intraday corrections
2- Consolidation between 10557-10578
3- Minor profit booking at higher levels
4- Whole day actual trading between 10521-10592
Conclusions from intra day chart analysis
Although minor profit booking at higher levels but good consolidation at lower levels also therefore on going Pull Back Rally continuation is expected towards following next resistances:-
1- 10598-10637
2- 10664-10700
3- 10703-10736(Gap resistance)
Watch levels for next trend confirmations amid Pull Back Rally continuation expectations
Intra Day Chart Analysis & Market Outlook
(26-02-2018)
Nifty-Intra Day Chart (23-Feb-2018):-
 |
| Just click on chart for its enlarged view |
1- Up moves with intraday corrections
2- More than last 3 hours slow up moves
3- Whole day actual trading between 10397-10499
Conclusions from intra day chart analysis
Following line was told in previous outlook on 21-02-2018 in "Emergence of Pull Back Rally possibility":-
emergence of Pull Back Rally possibility in the coming sessions but follow up consolidation is must for sustaining above 10429
As good follow up consolidation on 22-02-2018 therefore strong rally was seen on 23-02-2018 through up moves with intraday corrections but last hours up moves were slow therefore some more consolidation is firstly required near about last Friday highest(10499) for rally continuation.
It is clear that last Friday strong up moves were after 2 previous sessions good intraday consolidation between 10343-10376 therefore until complete selling will not develop till then decisive down moves will not be seen below 10343 and following next trend will be seen after valid break out of last 12 sessions trading range(10399-10637)
1- Below 10399 will mean correction continuation towards next supports(10343-10376 and 10277-10372)
2- Above 10612 first will mean strong signal of correction completion.
Just watch above levels for next trend confirmations amid Pull Back Rally continuation expectations in the beginning of next week.
Emergence of Pull Back Rally possibility
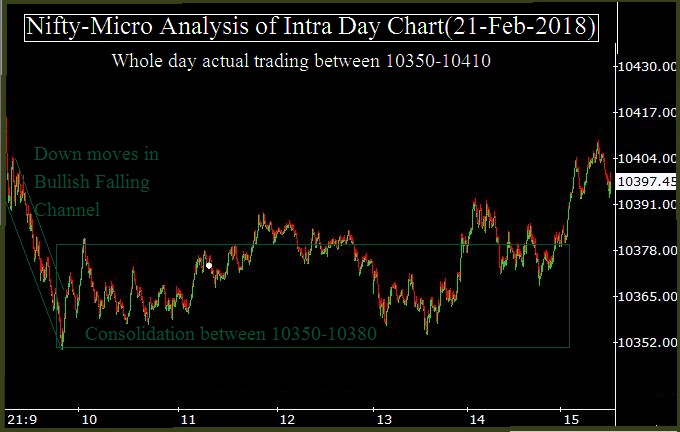
Intra Day Chart Analysis & Market Outlook
(22-02-2018)
Nifty-Intra Day Chart (21-Feb-2018):-
 |
| Just click on chart for its enlarged view |
1- Down moves in Bullish Falling Channel
2- Consolidation between 10350-10380
3- Whole day actual trading between 10350-10410
Conclusions from intra day chart analysis
Although selling was seen between 10380-10429 yesterday but fresh consolidation just below it between 10350-10380 today therefore emergence of Pull Back Rally possibility in the coming sessions but follow up consolidation is must for sustaining above 10429.
Finally slipping below immediate supports of Nifty
Intra Day Chart Analysis & Market Outlook
(21-02-2018)
Nifty-Intra Day Chart (20-Feb-2018):-
 |
| Just click on chart for its enlarged view |
1- Selling between 10380-10429
2- Sharp fall in last hour
3- Whole day actual trading between 10348-10429
Conclusions from intra day chart analysis
As firstly more than 5 hours selling and after that sharp fall in last hour therefore on going correction continuation is expected in the coming sessions.
Following lines were told on 18-02-2018 in "Firstly watch levels for next week big moves confirmations":-
1- firstly valid break out of last 7 Sessions trading range(10399-10637) will be watched for correction cotinuation towards next supports(10277-10372) below 10399 or first storng signal of correction completion above 10612.
2- high possibility of correction continuation after fresh selling
Correction remained contined in both previous sessions and today closing was within above mentioned next supports(10277-10372) at 10360.40 today.
Nifty got supports between 10304-10342 yesterday and closed above it today but after fresh selling between 10380-10429 therefore expected that Nifty will firstly trade and prepare for next decisive moves between 10304-10429 tomorrow.
Although immediate supports of Nifty are between 10277-10342 but higher levels good selling in previous weeks therefore expected that finally Nifty will slip below 10277 after fresh selling in the coming 1/2 sessions.
Firstly watch levels for next week big moves confirmations
Intra Day Chart Analysis & Market Outlook
(19-02-2018)
Nifty-Intra Day Chart (16-Feb-2018):-
 |
| Just click on chart for its enlarged view |
 |
| Just click on chart for its enlarged view |
1- Down moves in Bullish Falling Channel
2- Selling between 10494-10523
3- Bullish Falling Wedge like formations in last hours between 10435-10462
4- Whole day actual trading between 10435-10612
Conclusions from intra day chart analysis
Although closing at lower levels of the day after 0.88% negative closing last Friday but consolidation patterns formations were also seen therefore view will be cautious and firstly valid break out of last 7 Sessions trading range(10399-10637) will be watched for correction cotinuation towards next supports(10277-10372) below 10399 or first storng signal of correction completion above 10612.
As most Global markets were strong but Indian markets weakness last Friday is telling that Indian markets under performed therefore high possibility of correction continuation after fresh selling but precautionally valid break out of 10399-10637 should also be watched in next week for big moves confirmations.
Firstly watch levels amid correction continuation expectations
Intra Day Chart Analysis & Market Outlook
(16-02-2018)
Nifty-Intra Day Chart (15-Feb-2018):-
 |
| Just click on chart for its enlarged view |
1- Mixed Patterns formation between 10552-10618
2- High Volatility
3- Whole day actual trading between 10512-10618
Conclusions from intra day chart analysis
Although Green closing after whole day positive zone trading but complete consolidation was not seen and most time trading was with Mixed Patterns formation therefore view will not be Bullish.
As whole day today trading was with high volatility amid most Bullish Global markets and Nifty closed only 0.42% up therefore Indian markets today trading will be understood with under performance.
1st resistance between 10524-10577 was updated yesterday and today closing was within this range at 10545.50 therefore sustaining beyond 10524-10612 should also be firstly watched for next decisive moves confirmations amid correction continuation expectations.
Correction continuation towards next supports
Intra Day Chart Analysis & Market Outlook
(15-02-2018)
Nifty-Intra Day Chart (14-Feb-2018):-
 |
| Just click on chart for its enlarged view |
Technical Patterns formation in today intraday charts
1- More than 5 hours selling between 10524-10577
2- Sharp fall in last half hour
3- Whole day actual trading between 10457-10577
Conclusions from intra day chart analysis
Correction is very much on and its continuation will be seen towards following supports after fresh selling today:-
1- 10277-10372
2- 10140-10195
3- 10040-10175
Resistances above today closing are as follows:-
1- 10524-10577
2- 10589-10637
3- 10703-10736(gap resistance)
We started to tell for 5 Waves correction after Budget from 31-01-2018 and being seen since then. Detailed analysis of nature and depth of correcttion has already been updated in previous outlooks,just go through amid correction continuation expectations.
Subscribe to:
Posts (Atom)