

Emergence of Pull Back Rally possibility
Intra Day Chart Analysis & Market Outlook
(22-02-2018)
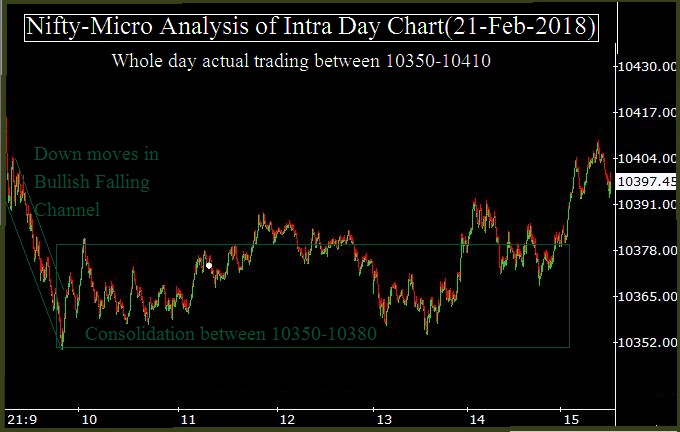
Nifty-Intra Day Chart (21-Feb-2018):-
 |
| Just click on chart for its enlarged view |
1- Down moves in Bullish Falling Channel
2- Consolidation between 10350-10380
3- Whole day actual trading between 10350-10410
Conclusions from intra day chart analysis
Although selling was seen between 10380-10429 yesterday but fresh consolidation just below it between 10350-10380 today therefore emergence of Pull Back Rally possibility in the coming sessions but follow up consolidation is must for sustaining above 10429.