

ॐ ह्रीं श्रीं लक्ष्मीभयो नमः॥

FII & DII trading activity in Capital Market Segment on 30-Apr-2013
| ||||||||||||||||
| ||||||||||||||||
Nifty Spot-Levels & Trading Strategy for 02-05-2013
Nifty Spot-Levels
R3 6067
R2 6014
R1 5972
Avg 5919
S1 5877
S2 5824
S3 5782
Nifty Spot-Trading Strategy
H6 6026 Trgt 2
H5 6004 Trgt 1
H4 5982 Long breakout
H3 5956 Go Short
H2 5947
H1 5938
L1 5921
L2 5912
L3 5903 Long
L4 5877 Short Breakout
L5 5855 Trgt 1
L6 5833 Trgt 2
R3 6067
R2 6014
R1 5972
Avg 5919
S1 5877
S2 5824
S3 5782
Nifty Spot-Trading Strategy
H6 6026 Trgt 2
H5 6004 Trgt 1
H4 5982 Long breakout
H3 5956 Go Short
H2 5947
H1 5938
L1 5921
L2 5912
L3 5903 Long
L4 5877 Short Breakout
L5 5855 Trgt 1
L6 5833 Trgt 2
Indian Stock Markets Closing Reports(01-Apr-2013)
Main features of today trading are as follows
RatiosIndex Options Put Call Ratio: 1.35
Total Options Put Call Ratio: 1.26
Nifty P/E Ratio(01-Apr-2013):17.70
Advances & Declines
BSE Advances : 1,071
BSE Declines : 1,268
NSE Advances : 605
NSE Declines : 699
Nifty Open Interest Changed Today
Nifty- 5600 CE(May)- -5,100(-0.41%)
Nifty- 5600 PE(May)- 356,000(9.82%)
Nifty- 5700 CE(May)- -621,750(-23.43%)
Nifty- 5700 PE(May)- 776,200(14.10%)
Nifty- 5800 CE(May)- 98,500(2.80%)
Nifty- 5800 PE(May)- 872,150(15.97%)
Nifty- 5900 CE(May)- 372,300(7.98%)
Nifty- 5900 PE(May)- -205,550(-5.45%)
Nifty- 6000 CE(May)- 389,400(9.34%)
Nifty- 6000 PE(May)- 9,350(0.79%)
Closing
Sensex- closed at 19,504.18(116.68 Points & 0.60%)
Nifty- closed at 5,930.20(26.10 Points & 0.44%)
CNX Midcap - closed at 7,818.60(8.20 Points & 0.10%)
CNX Smallcap- closed at 3,224.75(-0.45 Points & -0.01%)
Nifty(May Fut)-Levels & Trading Strategy for 02-05-2013
Nifty(May Fut)-Levels
R3 6071
R2 6018
R1 5973
Avg 5920
S1 5875
S2 5822
S3 5777
Nifty(May Fut)-Trading Strategy
H6 6028 Trgt 2
H5 6005 Trgt 1
H4 5982 Long breakout
H3 5955 Go Short
H2 5946
H1 5937
L1 5920
L2 5911
L3 5902 Long
L4 5875 Short Breakout
L5 5852 Trgt 1
L6 5829 Trgt 2
R3 6071
R2 6018
R1 5973
Avg 5920
S1 5875
S2 5822
S3 5777
Nifty(May Fut)-Trading Strategy
H6 6028 Trgt 2
H5 6005 Trgt 1
H4 5982 Long breakout
H3 5955 Go Short
H2 5946
H1 5937
L1 5920
L2 5911
L3 5902 Long
L4 5875 Short Breakout
L5 5852 Trgt 1
L6 5829 Trgt 2
Bank Nifty(May Fut)-Levels & Trading Strategy for 02-05-2013
Bank Nifty(May Fut)-Levels
R3 12977
R2 12823
R1 12659
Avg 12505
S1 12341
S2 12187
S3 12023
Bank Nifty(May Fut)-Trading Strategy
H6 12816 Trgt 2
H5 12743 Trgt 1
H4 12669 Long breakout
H3 12582 Go Short
H2 12553
H1 12524
L1 12465
L2 12436
L3 12407 Long
L4 12320 Short Breakout
L5 12246 Trgt 1
L6 12173 Trgt 2
Mid-session Outlook-2(30-04-2013)
All trends are up and technically market is well prepared for up moves after Short/Intermediate Term correction completion but uncertainty developed after Supreme Court observations and hard comments on the government today. Let CBI reply to Supreme Court unfold then next trend will be decided according to the survival possibility of Manmohan Singh Govt. As this matter is serious therefore we are continuously cautioning for the last 3 days.
Finally sustaining beyond previous 3 sessions lowest(5862) will decide next trend because good consolidations above it in previous 2 sessions.
Mid-session Outlook(30-04-2013)
As Supreme Court hard comments on the government over the multi-million coal-scam therefore slipping sharply and next decisive moves will depend on the stability of Manmohan Singh Govt. Finally sustaining beyond previous 3 sessions lowest(5862) will decide next trend because good consolidations above it in previous 2 sessions.
Post-open Outlook(30-04-2013)
As good consolidations yesterday therefore up moves possibilities above 5922 was updated yesterday and it was seen today as well. Coal Scam hearing will start after 10 AM in Supreme Court today and there are some problems for Central Govt. after CBI chief affidavit and high volatility can not be ruled out today. If something comes out against Manmohan Singh then next moves will be considered according to stability impact on Govt.
Technical Analysis and Market Outlook(30-04-2013)
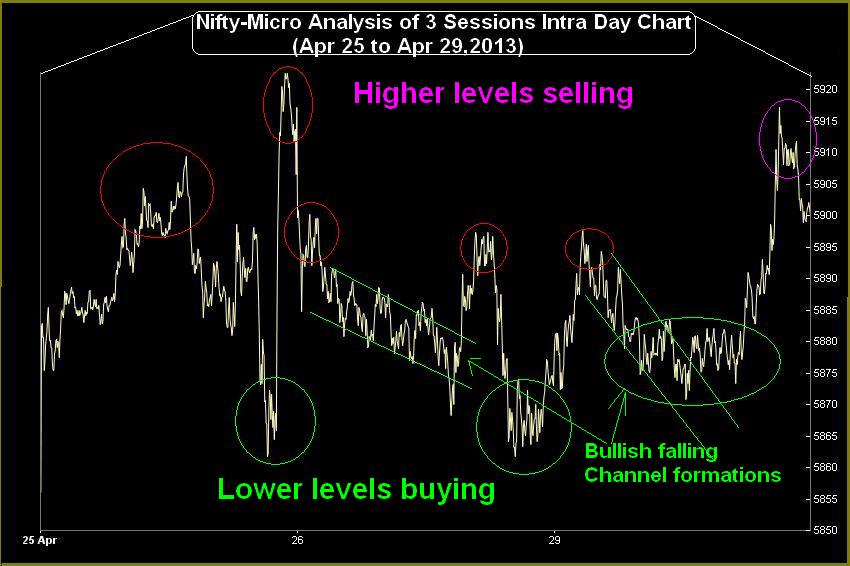
Nifty-Intra Day Chart (Apr 25 to Apr 29,2013):-
Technical Patterns and Formations in last 3 Sessions intraday charts
1- Higher levels selling and lower levels buying patterns formations in last 3 sessions.
2- High volatility in last hours on 25-04-2013.
3- Bullish falling Channel formations on 26-04-2013 and 29-04-2013.
4- Good consolidations at lower levels on 29-04-2013.
5- 3 Sessions actual trading between 5862-5922.
Range bound 3 sessions with both lower levels buying and higher levels selling patterns formations therefore mixed formations. Although good selling at higher levels in both previous sessions but good consolidations was seen on 29-04-2013 also therefore Indian markets are technically poised for any side moves beyond 3 Sessions trading range(5862-5922)
All trends are up and Short Term correction is due because indicators are overbought after 447 points rally in 10 sessions but good lower levels consolidations in both previous sessions therefore up moves possibilities above 5922 are higher after completion of correction within range bound market. If something extremely against Manmohan Singh happens by Supreme Court tomorrow then deeper correction will be seen otherwise rally will remain continued.
 |
| Just click on chart for its enlarged view |
1- Higher levels selling and lower levels buying patterns formations in last 3 sessions.
2- High volatility in last hours on 25-04-2013.
3- Bullish falling Channel formations on 26-04-2013 and 29-04-2013.
4- Good consolidations at lower levels on 29-04-2013.
5- 3 Sessions actual trading between 5862-5922.
Conclusions from 3 Sessions intra day chart analysis
Range bound 3 sessions with both lower levels buying and higher levels selling patterns formations therefore mixed formations. Although good selling at higher levels in both previous sessions but good consolidations was seen on 29-04-2013 also therefore Indian markets are technically poised for any side moves beyond 3 Sessions trading range(5862-5922)
All trends are up and Short Term correction is due because indicators are overbought after 447 points rally in 10 sessions but good lower levels consolidations in both previous sessions therefore up moves possibilities above 5922 are higher after completion of correction within range bound market. If something extremely against Manmohan Singh happens by Supreme Court tomorrow then deeper correction will be seen otherwise rally will remain continued.

FII & DII trading activity in Capital Market Segment on 29-Apr-2013
| ||||||||||||||||
| ||||||||||||||||
Indian Stock Markets Closing Reports(29-Apr-2013)
Main features of today trading are as follows
Ratios
Index Options Put Call Ratio: 1.18
Total Options Put Call Ratio: 1.07
Nifty P/E Ratio(29-Apr-2013): 17.59
Advances & Declines
BSE Advances : 1,263
BSE Declines : 1,087
NSE Advances : 747
NSE Declines : 564
Nifty Open Interest Changed Today
Nifty- 5600 CE(May)- -33,650(-2.62%)
Nifty- 5600 PE(May)- 168,100(4.86%)
Nifty- 5700 CE(May)- -54,450(-2.01%)
Nifty- 5700 PE(May)- 623,750(12.78%)
Nifty- 5800 CE(May)- 7,950(0.23%)
Nifty- 5800 PE(May)- 354,100(6.93%)
Nifty- 5900 CE(May)- 76,050(1.66%)
Nifty- 5900 PE(May)- 503,500(15.41%)
Nifty- 6000 CE(May)- 256,100(6.55%)
Nifty- 6000 PE(May)- 138,450(13.16%)
Closing
Sensex- closed at 19,387.50(100.78 Points & 0.52%)
Nifty- closed at 5,904.10(32.65 Points & 0.56%)
CNX Midcap - closed at 7,810.40(95.25 Points & 1.23%)
CNX Smallcap- closed at 3,225.20(5.65 Points & 0.18%)
Nifty Spot-Levels & Trading Strategy for 30-04-2013
Nifty Spot-Levels
R3 5975
R2 5946
R1 5925
Avg 5896
S1 5875
S2 5846
S3 5825
Nifty Spot-Trading Strategy
H6 5954 Trgt 2
H5 5942 Trgt 1
H4 5931 Long breakout
H3 5917 Go Short
H2 5913
H1 5908
L1 5899
L2 5894
L3 5890 Long
L4 5876 Short Breakout
L5 5865 Trgt 1
L6 5853 Trgt 2
R3 5975
R2 5946
R1 5925
Avg 5896
S1 5875
S2 5846
S3 5825
Nifty Spot-Trading Strategy
H6 5954 Trgt 2
H5 5942 Trgt 1
H4 5931 Long breakout
H3 5917 Go Short
H2 5913
H1 5908
L1 5899
L2 5894
L3 5890 Long
L4 5876 Short Breakout
L5 5865 Trgt 1
L6 5853 Trgt 2
Nifty(May Fut)-Levels & Trading Strategy for 30-04-2013
Nifty(May Fut)-Levels
R3 5990
R2 5962
R1 5940
Avg 5912
S1 5890
S2 5862
S3 5840
Nifty(May Fut)-Trading Strategy
H6 5968 Trgt 2
H5 5956 Trgt 1
H4 5945 Long breakout
H3 5931 Go Short
H2 5927
H1 5922
L1 5913
L2 5908
L3 5904 Long
L4 5890 Short Breakout
L5 5879 Trgt 1
L6 5867 Trgt 2
R3 5990
R2 5962
R1 5940
Avg 5912
S1 5890
S2 5862
S3 5840
Nifty(May Fut)-Trading Strategy
H6 5968 Trgt 2
H5 5956 Trgt 1
H4 5945 Long breakout
H3 5931 Go Short
H2 5927
H1 5922
L1 5913
L2 5908
L3 5904 Long
L4 5890 Short Breakout
L5 5879 Trgt 1
L6 5867 Trgt 2
Bank Nifty(May Fut)-Levels & Trading Strategy for 30-04-2013
Bank Nifty(May Fut)-Levels
R3 12870
R2 12760
R1 12671
Avg 12561
S1 12472
S2 12362
S3 12273
Bank Nifty(May Fut)-Trading Strategy
H6 12784 Trgt 2
H5 12738 Trgt 1
H4 12692 Long breakout
H3 12637 Go Short
H2 12619
H1 12601
L1 12564
L2 12546
L3 12528 Long
L4 12473 Short Breakout
L5 12427 Trgt 1
L6 12381 Trgt 2
R3 12870
R2 12760
R1 12671
Avg 12561
S1 12472
S2 12362
S3 12273
Bank Nifty(May Fut)-Trading Strategy
H6 12784 Trgt 2
H5 12738 Trgt 1
H4 12692 Long breakout
H3 12637 Go Short
H2 12619
H1 12601
L1 12564
L2 12546
L3 12528 Long
L4 12473 Short Breakout
L5 12427 Trgt 1
L6 12381 Trgt 2
Mid-session Outlook-2(29-04-2013)
Although selling signals at higher levels but lower levels good consolidations today and until Nifty will not sustaining below today lowest(5869) till then next down moves will not be considered.
Mid-session Outlook(29-04-2013)
As previous 2 sessions range bound market with both lower levels buying and higher levels selling patterns between 5862-5922 therefore market was not prepared for any side decisive moves and trading as well as preparing for next moves between mentioned range.
Some selling signals at higher levels today but lower levels good buying last Friday therefore firstly valid break out of 5862-5922 should be watched for next Short Term Trend confirmations.
Some selling signals at higher levels today but lower levels good buying last Friday therefore firstly valid break out of 5862-5922 should be watched for next Short Term Trend confirmations.
Short Term Correction Possibility
Technical Analysis,Research & Weekly Outlook
Technical Analysis,Research & Weekly Outlook
(Apr 29 to May 03,2013)
Nifty-EOD Chart (26-Apr-2013):- |
| Just click on chart for its enlarged view |
1- Impulsive Wave 3 completion at 6111.80 on 29-01-2013
2- Corrective Wave 4 continuation
3- Wave A(5663.60 on 04-03-2012)
4- Wave B(5971.20 on 11-03-2012)
5- Corrective Wave C of Wave 4 completion(5477.20 on 10-04-2013)
6- Impulsive Wave 5 continuation and its top formation at 5924.60 on 25-04-2013.
3- Bearish Harami Candle formation on 26-04-2013 near the top of on going Wave-5
Conclusions from EOD chart analysis
Impulsive Wave 1 begun at 4531.15 on 20-12-2011 after 13 Months correction completion and Wave 3 was completed at 6111.80 on 29-01-2013. Detailed analysis of Wave 1 to Wave 3 has already been updated in following topic on 21-04-2013:-
Impulsive Wave 5 is on after Wave 4 correction completion at 5477.20 on 10-04-2013 and its top formation at 5924.60 on 25-04-2013. Technically Wave-5 should form new top above the highest of Wave-3(6111.80). As per Elliot Wave Theory:-
Wave-3 should never be shorter than both Wave-1 and Wave-5
Wave-3 gained 1341.55 Points 6111.80(Wave-3 top)-4770.25(Wave-3 bottom)
Wave-5 should not gain more than 1341.55 Points which started from 5477.20 therefore its highest level will be less than 6818.75(5477.20+1341.55)
Fibonacci Levels above Wave-3 top(6111.80) are as follows:-
113.0%- 6193
123.6%- 6260
127.0%- 6282
138.2%- 6353
150.0%- 5428
161.8%- 6502
As 161.8% is crucial therefore firstly its possibility will be considered. Technically Wave-5 failure or its completions after double top formations possibility should be kept in mind because it also happens sometimes.
It is confirm that market require complete selling patterns minimum on Daily charts for reevrsal of Wave-5 and until that will not happen till then its continuation will be seen.
Nifty-Intra Day Chart (Apr 25 & Apr 26,2013):-
 |
| Just click on chart for its enlarged view |
1- Higher levels selling and lower levels buying patterns formations.
2- High volatility in last hours on 25-04-2013.
3- Bullish falling Channel formations on 26-04-2013.
4- 2 Sessions actual trading between 5862-5922
Conclusions from 2 Sessions intra day chart analysis
Range bound 2 sessions with both buying and selling patterns formations therefore mixed formations with good selling at higher levels and complete consolidations are required for next up moves above 5862.
Conclusions (After Putting All Studies Together)
All trends are up but Short term Indicators are overbought after 447 points rally in 10 sessions. As Bearish Harami Candle formation on 26-04-2013 near the top of on going rally with higher levels selling also in last 2 sessions between 5862-5922 therefore correction will also be considered and confirmations will be after valid breaking down of previous 2 sessions lowest(5862).
As Political temperature will be high in next week because of CBI chief affidavit in Apex court disclosing P.M.interference therefore volatility will be high. Technically Short Term Correction is due and if political situations worsen then deeper correction will be seen. R.B.I. Credit Policy will be announced on 3rd May and high possibility of rates reduction as well as CRR cut.
Technically up moves are expected after correction completion if no immediate risk to Manmohan Singh Government.

FII & DII trading activity in Capital Market Segment on 26-Apr-2013
| ||||||||||||||||
| ||||||||||||||||
Subscribe to:
Posts (Atom)