

Nifty-Intra Day Chart (Apr 25 to Apr 29,2013):-
Technical Patterns and Formations in last 3 Sessions intraday charts
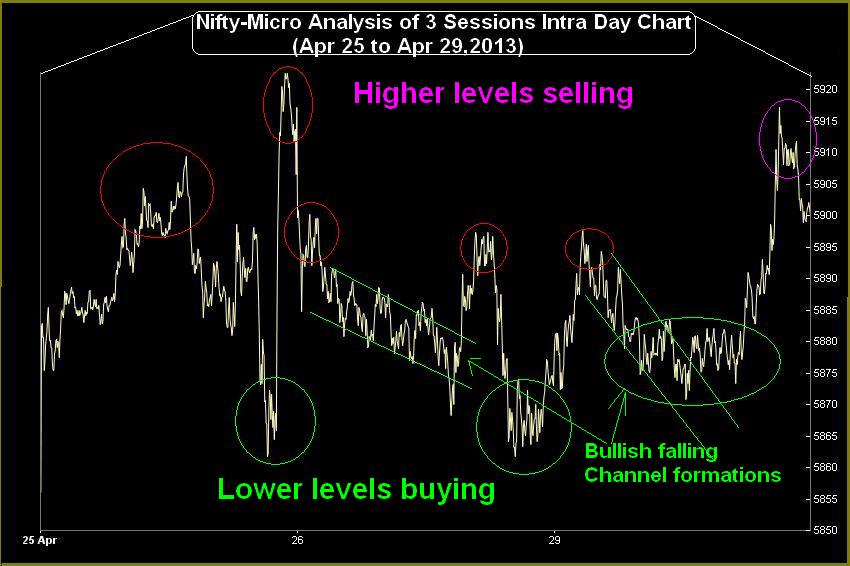
1- Higher levels selling and lower levels buying patterns formations in last 3 sessions.
2- High volatility in last hours on 25-04-2013.
3- Bullish falling Channel formations on 26-04-2013 and 29-04-2013.
4- Good consolidations at lower levels on 29-04-2013.
5- 3 Sessions actual trading between 5862-5922.
Range bound 3 sessions with both lower levels buying and higher levels selling patterns formations therefore mixed formations. Although good selling at higher levels in both previous sessions but good consolidations was seen on 29-04-2013 also therefore Indian markets are technically poised for any side moves beyond 3 Sessions trading range(5862-5922)
All trends are up and Short Term correction is due because indicators are overbought after 447 points rally in 10 sessions but good lower levels consolidations in both previous sessions therefore up moves possibilities above 5922 are higher after completion of correction within range bound market. If something extremely against Manmohan Singh happens by Supreme Court tomorrow then deeper correction will be seen otherwise rally will remain continued.
 |
| Just click on chart for its enlarged view |
1- Higher levels selling and lower levels buying patterns formations in last 3 sessions.
2- High volatility in last hours on 25-04-2013.
3- Bullish falling Channel formations on 26-04-2013 and 29-04-2013.
4- Good consolidations at lower levels on 29-04-2013.
5- 3 Sessions actual trading between 5862-5922.
Conclusions from 3 Sessions intra day chart analysis
Range bound 3 sessions with both lower levels buying and higher levels selling patterns formations therefore mixed formations. Although good selling at higher levels in both previous sessions but good consolidations was seen on 29-04-2013 also therefore Indian markets are technically poised for any side moves beyond 3 Sessions trading range(5862-5922)
All trends are up and Short Term correction is due because indicators are overbought after 447 points rally in 10 sessions but good lower levels consolidations in both previous sessions therefore up moves possibilities above 5922 are higher after completion of correction within range bound market. If something extremely against Manmohan Singh happens by Supreme Court tomorrow then deeper correction will be seen otherwise rally will remain continued.