ॐ ह्रीं श्रीं लक्ष्मीभयो नमः॥


Trading "calls" from our "Software" with more than "90% accuracy"

 This is the "Oldest & Only Website" of whole World
which is updating Nifty & Indian Stock Markets
"Daily and Weekly accurate Outlooks" 
with "Intraday Charts Analysis"for the 
last more than "14 years" means from "2010"
For its live Proofs just see "Archive"
in the "bottom of this Website".

Melting Global Markets and Correction continuation

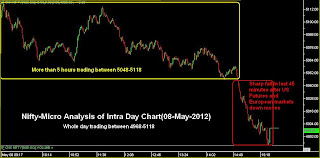
Nifty-Intra Day Chart (08-May-2012):-
Just click on chart for its enlarged view
Technical Patterns and Formations in today intraday charts

1- More than 5 hours trading between 5048-5118
2- Sharp fall in last 45 minutes after US Futures and European markets down moves.
3- Whole day trading between 4968-5118

Conclusions from intra day chart analysis 

As Dow's Futures was more than 70 points down and European markets Futures were also in deep Red today morning therefore Indian and European markets opened weak and closed in deep Red after almost whole day negative zone trading.

Melting Global markets and Us markets are also more than 1.5% down today therefore Global sentiment is completely dampened and more weakness can not be ruled out in all the Global markets including Indian markets.

Sharp declines today after Resistance at 200-Day SMA and next supports are as follows:-

1- 4995-5068
2- 4810-4900
3- 4635-4663
4- 4602-4624
5- 4560-4590  

Correction is on and Global sentiment is depressing therefore above supports testing is possible. Let US and European markets stabilise and Global sentiment improve then up moves will be considered after consolidation and bottom/base formations.  
FII Trading Data in Derivatives Segment on 08-May-2012


FII & DII trading activity in Capital Market Segment on 08-May-2012

FII trading activity on NSE and BSE in Capital Julket Segment(In Rs. Crores)
CategoryDateBuy ValueSell ValueNet Value
FII08-May-20121905.582304.56-398.98

DII trading activity on NSE and BSE in Capital Julket Segment(In Rs. Crores)
CategoryDateBuy ValueSell ValueNet Value
DII08-May-20121177.65920.05257.6

Indian Stock Markets Closing Reports(08-May-2012)

Main features of today trading are as follows

1- Long Black Candle formation.
2- Benchmark Indices closed more than 2% down after sharp down moves in last hours.
3- All the Indices closed in Red and near lower levels of the day.

Ratios

Nifty Put Call Ratio: 0.94
Nifty P/E Ratio(08-May-2012):17.15

Advances & Declines

BSE Advances : 1051
BSE Declines : 1696
NSE Advances :  432
NSE Declines :  991

Nifty Open Interest Changed Today

Nifty- 4800 CE(May)- +94900(+16.26%)
Nifty- 4800 PE(May)- +983400(+26.00%)

Nifty- 4900 CE(May)- +74800(+9.38%)
Nifty- 4900 PE(May)- +1092250(+29.95%)

Nifty- 5000 CE(May)- +1163700(+58.79%)
Nifty- 5000 PE(May)- +259200(+3.90%)

Nifty- 5100 CE(May)- +1100600(+38.84%)
Nifty- 5100 PE(May)- -291950(-6.33%)

Nifty- 5200 CE(May)- +1236450(+24.52%)
Nifty- 5200 PE(May)- +34550(+1.44%)

Closing 

Nifty- closed at 4,999.95(-114.20 Points & -2.23%)
Sensex- closed at 16,546.18(-366.53 Points & -2.17% )
CNX Midcap - closed at 7,132.90(-107.20 Points & -1.48%)
BSE Smallcap- closed at 6,550.82(-57.53 Points & -0.87%)

Nifty Spot-Levels & Trading Strategy for 09-05-2012

Nifty Spot-Levels

R3 5220
R2 5169
R1 5084
Avg 5033
S1 4948
S2 4897
S3 4812

Nifty Spot-Trading Strategy

H6 5135     Trgt 2
H5 5104     Trgt 1
H4 5073     Long breakout
H3 5036     Go Short
H2 5023
H1 5011
L1 4986
L2 4974
L3 4961     Long
L4 4924     Short Breakout
L5 4893     Trgt 1
L6 4862     Trgt 2

Nifty(May Fut)-Levels & Trading Strategy for 09-05-2012

Nifty(May Fut)-Levels

R3 5230
R2 5178
R1 5091
Avg 5039
S1 4952
S2 4900
S3 4813

Nifty(May Fut)-Trading Strategy

H6 5144     Trgt 2
H5 5112     Trgt 1
H4 5081     Long breakout
H3 5043     Go Short
H2 5030
H1 5017
L1 4992
L2 4979
L3 4966     Long
L4 4928     Short Breakout
L5 4897     Trgt 1
L6 4865     Trgt 2

Bank Nifty(May Fut)-Levels & Trading Strategy for 09-05-2012

Bank Nifty(May Fut)-Levels

R3 10242
R2 10078
R1 9817
Avg 9653
S1 9392
S2 9228
S3 8967

Bank Nifty(May Fut)-Trading Strategy

H6 9984     Trgt 2
H5 9886     Trgt 1
H4 9789     Long breakout
H3 9672     Go Short
H2 9633
H1 9594
L1 9517
L2 9478
L3 9439     Long
L4 9322     Short Breakout
L5 9225     Trgt 1
L6 9128     Trgt 2
Blog will be updated after 06:00 PM today.

Wave-3 Strong Rally First Confirmation above 200-Day SMA(5115)

Technical Analysis and Research For 08-05-2012

Nifty-EOD Chart (07-May-2012):-
Just click on chart for its enlarged view
Technical Patterns and Formations in EOD charts

1- Wave-1 1098.80 Nifty Points rally in 45 sessions
2- Wave-2 52 Sessions correction in Falling Channel(Bullish Flag Formation)
3- Wave-2 Three Lower Tops and Three Lower Bottoms Formation during correction.
4- Wave-2 Fifth Wave formation during correction.

Conclusions from EOD chart analysis 

As B3 was not completed therefore following lines were told in "Lower Tops and Lower Bottoms Formation In On Going Correction" on 15-04-2012

"Correction is on and its completion is required yet. As lower tops and lower bottoms formations in on going correction therefore new bottom B3 formations possibility below 5135.95 can not be ruled out in the coming week/weeks"

After B3 formation- 3 Lower Tops and 3 Lower Bottoms are as follows:-

T1(5629.95)
T2(5499.40)
T3(5378.75)
B1(5171.45)
B2(5135.95)
B3((completion indication at 4988.00 on 07-05-2012) 

Technical requirement of 'B3' formation has been completed after after slipping below 5135.95. Now 5th and final corrective Sub wave is continued during 52 Sessions correction and its completion indication is also seen after strong recovery from lower levels on 07-05-2012.

Wave-2 correction is in "Falling Channel(Bullish Flag Formation)" therefore it is confirm that impulsive Wave-3 will be seen after its completion.  As Sub Wave-5 is on and technical requirement of 'B3' formation has been completed in on going correction therefore now Indian markets are very much prepared for impulsive Wave-3 rally. Wave-3 can never be shorter than Wave-1 therefore more than Wave-1 gains will be seen after correction completion.

Strong indication of correction completion after more than 2% recovery from lower levels on 07-05-2012 and only its confirmation is required which will be after sustaining above following levels and resistances;-

1- 200-Day SMA(Today at 5115)
2- Resistance between 5190-5305
3- Resistance between 5318-5337
4- Resistance between 5357-5377

Although multiple resistances upto 5625 but sustaining above 5377 will be confirmation of strong Wave-3 rally.Expected that Nifty will not slip below 4988 and Wave-3 rally will be seen above 5115/5377/5625.

Pre-open Outlook(08-05-2012)

Strong rally yesterday after intraday consolidation patterns between 4990-5021 and intraday supports at lower levels between 4990-5000 as well as no indication of short covering or selling yesterday. No specific direction from Global markets and sentiment is also quiet today morning therefore flat opening and slipping during consolidation process is possible but expected that up moves will remain continued and finally positive closing will be seen.

FII Trading Data in Derivatives Segment on 07-May-2012


FII & DII trading activity in Capital Market Segment on 07-May-2012

FII trading activity on NSE and BSE in Capital Julket Segment(In Rs. Crores)
CategoryDateBuy ValueSell ValueNet Value
FII07-May-20122162.562793.37-630.81

DII trading activity on NSE and BSE in Capital Julket Segment(In Rs. Crores)
CategoryDateBuy ValueSell ValueNet Value
DII07-May-20121327.641053.87273.77

Indian Stock Markets Closing Reports(07-May-2012)

Main features of today trading are as follows

1- Long White Candle.
2- Strong recovery from lower levels and closing near the highs of the day.
3- Benchmark Indices closed in Green.

Ratios

Nifty Put Call Ratio:0.98
Nifty P/E Ratio(07-May-2012):17.54

Advances & Declines

BSE Advances : 1398
BSE Declines : 1324
NSE Advances :  731
NSE Declines :  682

Nifty Open Interest Changed Today

Nifty- 5000 CE(May)- +818000(+70.44%)
Nifty- 5000 PE(May)- -9750(-0.15%)

Nifty- 5100 CE(May)- +384000(+15.21%)
Nifty- 5100 PE(May)- -537300(-10.44%)

Nifty- 5200 CE(May)- +846950(+18.80%)
Nifty- 5200 PE(May)- -626900(-20.74%)

Closing 

Nifty- closed at 5,114.15(+27.30 Points & +0.54%)
Sensex- closed at 16,912.71(+81.63 Points & +0.49% )
CNX Midcap - closed at 7,252.10(+24.65 Points & +0.34%)
BSE Smallcap- closed at 6,608.35(+20.09 Points & +0.30%)

Nifty Spot-Levels & Trading Strategy for 08-05-2012

Nifty Spot-Levels

R3 5298
R2 5211
R1 5162
Avg 5075
S1 5026
S2 4939
S3 4890

Nifty Spot-Trading Strategy

H6 5253     Trgt 2
H5 5221     Trgt 1
H4 5188     Long breakout
H3 5151     Go Short
H2 5138
H1 5126
L1 5101
L2 5089
L3 5076     Long
L4 5039     Short Breakout
L5 5006     Trgt 1
L6 4974     Trgt 2

Nifty(May Fut)-Levels & Trading Strategy for 08-05-2012

Nifty(May Fut)-Levels

R3 5313
R2 5226
R1 5175
Avg 5088
S1 5037
S2 4950
S3 4899

Nifty(May Fut)-Trading Strategy

H6 5266     Trgt 2
H5 5233     Trgt 1
H4 5200     Long breakout
H3 5162     Go Short
H2 5150
H1 5137
L1 5112
L2 5087
L3 5099     Long
L4 5049     Short Breakout
L5 5016     Trgt 1
L6 4983     Trgt 2

Bank Nifty(May Fut)-Levels & Trading Strategy for 08-05-2012

Bank Nifty(May Fut)-Levels

R3 10460
R2 10182
R1 10027
Avg 9749
S1 9594
S2 9316
S3 9161

Bank Nifty(May Fut)-Trading Strategy

H6 10323     Trgt 2
H5 10216     Trgt 1
H4 10110     Long breakout
H3 9991     Go Short
H2 9951
H1 9911
L1 9832
L2 9792
L3 9752     Long
L4 9633     Short Breakout
L5 9527     Trgt 1
L6 9420     Trgt 2

Pre-Closing Outlook(07-05-2012)

Strong recovery after 02:00PM today but When Indian markets were trading near the lower levels of today then following lines were told in Mid-session Outlook(07-05-2012):-

1- intraday consolidation patterns as well as intraday supports at lower levels between 4990-5000.
2- Certainly market require complete consolidation for any decisive up move and now further down moves will not be considered until Nifty will not sustain below 4990.
3- sustaining above 4990 will mean minimum Pull Back Rally.

Although whole global sentiment was most depressed but we projected consolidations and  minimum Pull Back Rally and it is being seen also after more than 125 points recovery of Nifty.

Firstly Watch sustaining beyond Long Term Trend decider 200-Day SMA(Today at 5117) for next trend confirmations amid crashing Global markets.

Mid-session Outlook(07-05-2012)

Dow's Futures is more than 100 points down and and most European markets opened more than 1.5% down today and all the Asian markets trading as well as closed in deep Red today.

Compltely dampened sentiment since morning today and Indian are also more than 1.5% down and Nifty is trading between 4990-5021 with intraday consolidation patterns as well as intraday supports at lower levels between 4990-5000. Certainly market require complete consolidation for any decisive up move and now further down moves will not be considered until Nifty will not sustain below 4990.

Foloow up consolidation in the coming hours with sustaining above 4990 will mean minimum Pull Back Rally.

Post-open Outlook(07-05-2012)

Gap down opening after crashing US and Asian markets and almost confirmation of Long Term Trend turning down. Correction continuation and now only Pull Back rally will be considered if market get intraday support at or above 61.8% retracement level(4950).

Firstly Watch Long Term Trend Survival & 200-Day SMA amid Global Crash

Technical Analysis,Research & Weekly Outlook
(May 07 to May 11,2012)
Nifty-Intra Day Chart (04-May-2012):-
Just click on chart for its enlarged view
Technical Patterns and Formations in today intraday charts

1- Down moves in Falling Channel without selling formations.
2- Intraday charts are showing showing consolidation pstterns.
3- Last more than 2 hours trading between 5071-5106 with intraday support and consolidation pstterns at lower level.
3- Whole day trading between 5071-5175

Conclusions from intra day chart analysis 

As almost whole day sharp down moves with intraday consolidation patterns and panic bottom formations with lower levels support also in last more than 2 hours therefore signals correction completion.

Nifty-EOD Chart (4-May-2012):-
Just click on chart for its enlarged view
Technical Patterns and Formations in EOD charts

1- Rally started on 20-12-2011 from 4532.
2- 1098.80 Nifty Points rally in 45 sessions.
3- Rally completion and correction started on 22-02-2012 from 5629.
4- 51 Sessions correction in Falling Channel(Bullish Flag Formation)
5- 3 Times support at 200-Day SMA in previous sessions.
6- 200-Day SMA(Today at 5117) broken down forcefully on 04-05-2012

Conclusions (After Putting All Studies Together)

Fibonacci Retracement Levels of 1098.80 Nifty Points rally(4531-5629) are as follows:-

13.0%- 5486(Tested)
23.6%- 5369(Tested)
27.0%- 5332(Tested)
38.2%- 5209(Tested)
50.0%- 5080(Tested)
61.8%- 4950
70.7%- 4852
76.4%- 4790
78.6%- 4765
88.6%- 4656

51 Sessions Correction is on in Falling Channel(Bullish Flag Formation) after 1098.80 Nifty Points rally and 200-Day SMA(Today at 5117) broken down forcefully on 04-05-2012,it is weakness indication. As correction completion has been seen many times after breaking down of 200-Day SMA during Intermediate term correction therefore sustaining beyond 200-Day SMA will be firstly watched in next week for the confirmation of Indian stock markets Long Term Trend.

Nifty slipped below 5136 on 04-05-2012 and it has fulfilled the technical requirement of 'B3' formation,its detailed analysis and possibility of slipping below 5136 has already been updated in following topic on 15-04-2012:- 

Lower Tops and Lower Bottoms Formation In On Going Correction

(Just click at above topic link and go through)

Global Crashing like situation after huge fall in all the US and European markets therefore weekly opening may be weak but firstly sustaining beyond 200-Day SMA(today at 5117) should be watched in the next couple of sessions because it will give confirmation of Long Term Trend survival.

Last Friday down moves were with intraday consolidation patterns and panic bottom formations also has been seen therefore correction completion possibility is alive near about 5080(50.0% Fibonacci Retracement Levels) and 200-Day SMA. As technical requirement of 'B3' formation has been fulfilled last Friday and on going correction is in Falling Channel(Bullish Flag Formation) therefore expected that finally strong rally will be seen after correction completion. 

Indian Stock Markets Closing Reports(04-May-2012)

Main features of today trading are as follows

1- Long Black Candle
2- All the Indices closed in Red.
30 Lowest closing after whole day down moves.

Ratios

Nifty Put Call Ratio: 0.98
Nifty P/E Ratio(04-May-2012): 17.45

Advances & Declines

BSE Advances :  713
BSE Declines : 2129
NSE Advances :  246
NSE Declines : 1207

Nifty Open Interest Changed Today

Nifty- 5000 CE(May)- +264550(+29.50%)
Nifty- 5000 PE(May)- +1539250(+30.04%)

Nifty- 5100 CE(May)- +1502650(+146.99%)
Nifty- 5100 PE(May)- -412350 (-7.42%)

Nifty- 5200 CE(May)- +1563100(+53.11%)
Nifty- 5200 PE(May)- -1214450(-28.66%)

Closing 

Nifty- closed at 5,086.85(-101.55 Points & -1.96%)
Sensex- closed at 16,831.08(-320.11 Points & -1.87% )
CNX Midcap - closed at 7,215.45(-142.75 Points & -1.94%)
BSE Smallcap- closed at 6,588.26(-121.70 Points & -1.81%)