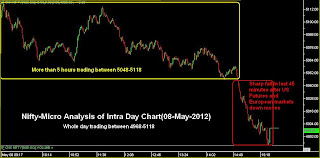
Nifty-Intra Day Chart (08-May-2012):-
Technical Patterns and Formations in today intraday charts
1- More than 5 hours trading between 5048-5118
2- Sharp fall in last 45 minutes after US Futures and European markets down moves.
3- Whole day trading between 4968-5118
As Dow's Futures was more than 70 points down and European markets Futures were also in deep Red today morning therefore Indian and European markets opened weak and closed in deep Red after almost whole day negative zone trading.
Melting Global markets and Us markets are also more than 1.5% down today therefore Global sentiment is completely dampened and more weakness can not be ruled out in all the Global markets including Indian markets.
Sharp declines today after Resistance at 200-Day SMA and next supports are as follows:-
1- 4995-5068
2- 4810-4900
3- 4635-4663
4- 4602-4624
5- 4560-4590
Correction is on and Global sentiment is depressing therefore above supports testing is possible. Let US and European markets stabilise and Global sentiment improve then up moves will be considered after consolidation and bottom/base formations.
 |
| Just click on chart for its enlarged view |
1- More than 5 hours trading between 5048-5118
2- Sharp fall in last 45 minutes after US Futures and European markets down moves.
3- Whole day trading between 4968-5118
Conclusions from intra day chart analysis
As Dow's Futures was more than 70 points down and European markets Futures were also in deep Red today morning therefore Indian and European markets opened weak and closed in deep Red after almost whole day negative zone trading.
Melting Global markets and Us markets are also more than 1.5% down today therefore Global sentiment is completely dampened and more weakness can not be ruled out in all the Global markets including Indian markets.
Sharp declines today after Resistance at 200-Day SMA and next supports are as follows:-
1- 4995-5068
2- 4810-4900
3- 4635-4663
4- 4602-4624
5- 4560-4590
Correction is on and Global sentiment is depressing therefore above supports testing is possible. Let US and European markets stabilise and Global sentiment improve then up moves will be considered after consolidation and bottom/base formations.

