

Sustaining beyond 25324-25401 will
confirm next decisive moves beginning
Nifty-Intra Day Chart Analysis & Market
Outlook(19-09-2024)
Nifty-Intra Day Chart (18-Sep-2024):-
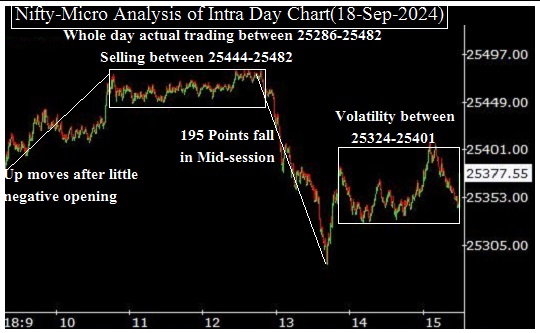
Technical Patterns formation in today intraday charts
1- Up moves after little negative opening
2- Selling between 25444-25482
3- 195 Points fall in Mid-session
4- Volatility between 25324-25401
5- Whole day actual trading between 25286-25482
Conclusions from intra day chart analysis
Although firstly up moves after little negative opening but higher levels selling developed in almost nrxt 2 hours and intraday selling was also seen in both previous sessions also therefore 195 points fall was seen in Mid-session. As volatile trading in last 2 hours between 25324-25401 therefore firstly sustaining beyond this range should be watched tomorrow for next decisive moves beginning confirmations.