

Down moves below today lowest
Nifty-Intra Day Chart Analysis &
Market Outlook(02-04-2024)
Nifty-Intra Day Chart (01-Apr-2024):-
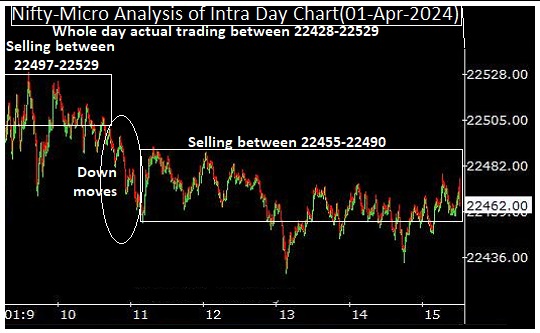
Technical Patterns formation in today intraday charts
1- Selling between 22497-22529
2- Down moves
3- Selling between 22455-22490
4- Whole day actual trading between 22428-22529
Conclusions from intra day chart analysis
Although firstly some up moves after positive opening but firstly selling was seen in first hour. As follow up selling in the last more than 4 hours therefore down moves will be seen below today lowest in the coming sessions. Finally sustaining beyond today lowest should be watched for next decisive moves beginning confirmations.