

Finally 19493-19798 will confirm next trend amid firstly up moves expectations
Technical Analysis,Research & Weekly Outlook
(Oct 03 to Oct 06,2023)
Nifty-EOD Chart Analysis
(Waves structure)
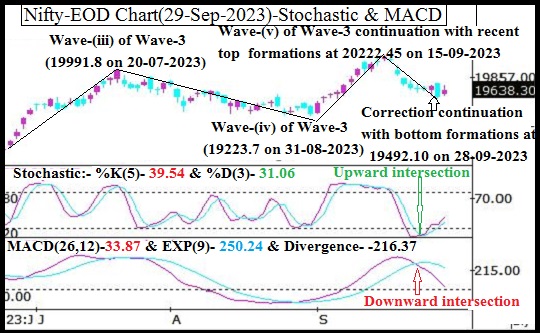
Nifty-EOD Chart (29-Sep-2023):-

Technical Patterns and Formations in EOD charts
1- Corrective Wave-C of "ABC correction" completion at 15183.4 on 17-06-2022 and Impulsive Wave-1 of new Waves structure beginning.
2- Impulsive Wave-1 completion at 18096.2 on 15-09-2022.
3- Corrective Wave-2 completion at 16747.7 on 30-09-2022.
4- Impulsive Wave-(i) of Wave-3 completion at 18887.6 on 01-12-2022.
5- Corrective Wave-(ii) of Wave-3 completion at 16828.3 on 20-03-2023.
6- Impulsive Wave-(iii) of Wave-3 completion at 19991.8 on 20-07-2023.
7- Corrective Wave-(iv) of Wave-3 completion at at 19223.7 on 31-08-2023.
8- Impulsive Wave-(v) of Wave-3 continuation with recent and life time top formations at 20222.45 on 15-09-2023 but Short Term correction beginning from this level.
9- Short Term correction continuation with recent bottom formations at 19492.10 on 28-09-2023.
Conclusions from EOD chart analysis
(Waves structure)
Impulsive Wave-1 of new Waves structure started after corrective Wave-C of "ABC correction" completion at 15183.4 on 17-06-2022. impulsive Wave-1 completed at 18096.2 on 15-09-2022 and corrective Wave-2 begun which completed at 16747.7 on 30-09-2022 and Impulsive Wave-(i) of Wave-3 started.
At present impulsive Wave-(v) of Wave-3 is in continuation with recent and life time top formations at 20222.45 on 15-09-2023 but Short Term correction begun from this level which is in continuation with recent bottom formations at 19492.10 on 28-09-2023 and no confirmation of its completion yet on EOD and intraday charts.
Nifty-EOD Chart Analysis
(Stochastic & MACD)
Nifty-EOD Chart (29-Sep-2023):-
Technical Patterns and Formations in EOD charts
1- Stochastic- %K(5) line has intersected %D(3) line upward and its both lines are rising from Over sold zone.
2- Stochastic:- %K(5)- 39.54 & %D(3)- 31.06.
3- Stochastic is showing negative/positive divergence
4- In MACD- MACD line has intersected Average line downward and its both lines are falling in positive zone.
5- MACD(26,12)-33.87 & EXP(9)- 250.24 & Divergence- -216.37
Conclusions from EOD chart analysis (Stochastic & MACD)
Positions of Daily indicators are as follows:-
1- As in Stochastic its %K(5) line has intersected %D(3) line upward and its both lines are rising from Over sold zone therefore showing signals of fresh up moves beginning in the coming week.
2- As in MACD indicator its MACD line has intersected Average line downward and its both lines are falling in positive zone as well as its MACD line is little above Zero line therefore suggesting stronger indications of downward trend formations. Divergence between its both lines has widened to 216.37 therefore some up moves also can not be ruled out hence this indicator is suggesting to adopt wait and watchful approach for final confirmations.
Nifty-EOD Chart Analysis
(Averages)
Nifty-EOD Chart (29-Sep-2023):-

Technical Patterns and Formations in EOD charts
Averages:-
1- 5-Day SMA is today at 19644
2- 21-Day SMA is today at 19761
3- 55-Day SMA is today at 19628
4- 100-Day SMA is today at 19216
5- 200-Day SMA is today at 18498
Conclusions from EOD chart analysis
(Averages)
Nifty is hovering around both Short and Intermediate Term deciding Averages(5-Day SMA,21-Day SMA and 55-Day SMA) for the last 6 sessions therefore Short and Intermediate Term trends are at stake. Let one sided clear intersection of these Averages happen then that side trend formations and decisive moves beginning will get confirmations.
Nifty-Intra Day Chart Analysis
(29-Sep-2023)
Nifty-Intra Day Chart (29-Sep-2023):-

Technical Patterns formation in today intraday charts
1- Consolidation between 19552-19604
2- Sharp up
3- Consolidation between 19653-19682
4- Selling between 19705-19726
5- Sharp fall in last hour
6- Whole day actual trading between 19552-19726
Conclusions from intra day chart analysis
Although firstly slipping after flat opening but lower levels consolidation developed therefore sharp up moves were seen after 11:00 AM. As follow up consolidation in Mid-session therefore after that some up moves were seen but higher levels fresh selling therefore Nifty had fallen more than 100 points in last hour,
As good intraday consolidation in comparison to selling therefore finally up moves are expected above last Friday highest(19726) but consolidation is also firstly required because some selling was also seen at higher levels last Friday.
Conclusions
(After putting all studies together)
1- Long Term trend is up.
2- Intermediate Term trend is at stake.
3- Short Term trend is at stake.
Short Term correction of impulsive Wave-(v) of Wave-3 is in continuation now with recent bottom formations at 19492.10 on 28-09-2023 and no confirmation of its completion yet on EOD and intraday charts.
Although Nifty had moves below 61.8%(18605) crucial retracement level during on going correction and hovered around Intermediate Term trend decider 55-Day SMA(today at 19628) in previous week but closed above both these levels last Friday therefore firstly sustaining beyond both these levels will be watched in the coming week for the life of on going correction.
As Short Term indicator Stochastic is showing signals of fresh up moves beginning in the coming week and last Friday intraday charts are showing good consolidation also therefore firstly up moves are expected towards next resistances in the beginning of next week:-
1- 19705-19726
2- 19761-19797
Next supports below last Friday closing are as follows:-
1- 19552-19604
2- 19493-19556
As Nifty traded in last 6 sessions between 19493-19798 with above mentioned supports and resistances in which Nifty has tested and broken down 2 most Crucial levels(61.8% retracement level & Intermediate Term trend decider 55-Day SMA) as well as both these levels are within last 6 sessions trading range therefore firstly sustaining it beyond should be watched in the coming week for next big moves beginning after following next trend formation confirmations:-
1- Sustaining above 19798 will mean strong rally beginning towards and above life time top(20222.45) after all trends turning upward confirmations.
2- Sustaining below 19493 will mean all trends turning downward confirmations and down moves continuation towards the bottom of Impulsive Wave-(v) of Wave-3(19223.7).
As last Friday intraday charts and Short Term indicator Stochastic are suggesting firstly up moves beginning possibility therefore firstly up moves are expected in next week but finally sustaining beyond 19493-19798 will confirm next trend therefore should be finally watched for next trend confirmations.