

Finally fresh rally towards & above
life time highest after volatility
within supports & resistances
Technical Analysis,Research & Weekly Outlook
(May 29 to Jun 02,2023)
Nifty-EOD Chart Analysis
(Waves structure)
Nifty-EOD Chart (26-May-2023):-

Technical Patterns and Formations in EOD charts
1- Corrective Wave-C of "ABC correction" completion at 15183.4 on 17-06-2022 and Impulsive Wave-1 of new Waves structure beginning.
2- Impulsive Wave-[(i)] of Wave-1 completion at 18096.2 on 15-09-2022.
3- Corrective Wave-[(ii)] of Wave-1 completion at 16747.7 on 30-09-2022.
4- Impulsive Wave-(i) of Wave-[(iii)] of Wave-1 completion at 18887.6 on 01-12-2022 and Corrective Wave-A of "ABC" correction begining.
5- Corrective Wave-A of Wave-[(ii)] of Wave-[(iii)] of Wave-1 completion at 17774.3 on 26-12-2022.
6- Corrective Wave-B of Wave-[(ii)] of Wave-[(iii)] of Wave-1 completion at 18265.3 on 30-12-2022.
7- Corrective Wave-C of Wave-[(ii)] of Wave-[(iii)] of Wave-1 completion strong indications after its recent bottom formation at 16828.3 on 20-03-2023.
8- Pull Back Rally continuation with recent top formation at 18508.55 on 26-05-2023.
Conclusions from EOD chart analysis
(Waves structure)
Impulsive Wave-1 of new Waves structure started from 15183.4 on 17-06-2022 after corrective Wave-C of "ABC correction" of previous Waves structure completion at this level. Impulsive Wave-[(i)] of Wave-1 completed at 18096.2 on 15-09-2022 and Corrective Wave-[(ii)] of Wave-1 started which completed at 16747.7 on 30-09-2022 and from this levels impulsive Wave-[(iii)] of Wave-1 begun.
Impulsive Wave-(i) of Wave-[(iii)] of Wave-1 completed at 18887.6 on 01-12-2022 and Corrective Wave-A of "ABC" correction begun. Now corrective Wave-C is in continuation with recent bottom formation at 16828.3 on 20-03-2023 and strongest signals of its completion have developed after 1680.25 points(9.98%) recovery from lower levels.
Nifty-EOD Chart Analysis
(Stochastic & MACD)
Nifty-EOD Chart (26-May-2023):-

Technical Patterns and Formations in EOD charts
1- Pull Back Rally beginning from 16828.3 on 20-03-2023.
2- Pull Back Rally continuation with recent top formation at 18508.55 on 26-05-2023.
3- Stochastic- %K(5) line has intersected %D(3) line upward and its both lines are rising towards Over bought zone.
4- Stochastic:- %K(5)- 77.46 & %D(3)- 73.17.
5- In MACD- MACD line has intersected Average line downward and its both lines are falling in positive zone.
6- MACD(26,12)- 106.60 & EXP(9)- 205.20 & Divergence- -98.6
Conclusions from EOD chart analysis
(Stochastic & MACD)
Positions of Daily indicators are as follows:-
1- As in Short Term indicator Stochastic %K(5) line has intersected %D(3) line upward and its both lines are rising towards Over bought zone therefore this indicator is suggesting more up moves possibilities because it has not developed Overbought yet.
2- As in MACD its MACD line has intersected Average line downward and its both lines are falling in positive zone therefore this indicator is indicating Very Short Term downward trend formation possibilities because its both lines are in positive zone.
Conclusion from indicators is that firstly limited up moves will develop and after that limited down moves be seen
Nifty-Intra Day Chart Analysis
(26-May-2023)
Nifty-Intra Day Chart (26-May-2023):-
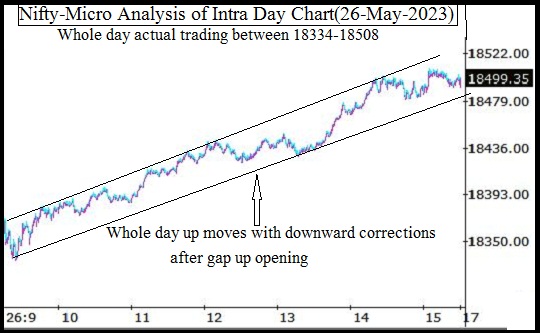
Technical Patterns formation in today intraday charts
1- Whole day up moves with downward corrections after gap up opening
2- Whole day actual trading between 18334-18508
Conclusions from intra day chart analysis
As whole day up moves with downward corrections after gap up opening and intraday selling patterns were not seen as well as last Friday closing was at the top of the day therefore on going rally continuation is expected in the beginning of next week.
Conclusions
(After putting all studies together)
All the trends are up. Pull Back rally continuation and no indication of its completion yet on EOD and Intraday charts therefore firstly up moves are expected towards following next resistances in the beginning of next week:-
1- 18559-18586
2- 18674-18696
3- 18832-18854
As Short Term Indicators are suggesting a Short Term correction possibility also and that may be seen after some up moves towards following next supports in the coming week therefore should be watched for fresh rally beginning towards and above life time highest(18887.6) after Short Term correction completion:-
1- 18419-18445
2- 18373-18397
3- 18325-18353
4- 18203-18261
5- 18059-18127
Expected that finally fresh rally will be seen towards and above life time highest(18887.6) in the coming week/weeks after volatility within above mentioned supports and resistances.