

Sideways market within supports & resistances if no big negative news from Russia-Ukraine
war front
Technical Analysis,Research & Weekly
Outlook(Mar 21 to Mar 25,2022)
Nifty-EOD Chart Analysis
(Stochastic & MACD)
Nifty-EOD Chart (17-Mar-2022):-

Technical Patterns and Formations in EOD charts
1- Impulsive Wave-5 completion after new life time top formation at 18604.50 on 19-10-2021 and corrective Wave-A of "ABC" correction beginning.
2- Corrective Wave-A completion at 16410.20 on 20-12-2021
3- Wave-B completion at 18351.00 on 18-01-2022.
4- Wave-C bottom formation at 15671.5 on 08-03-2022
5- Pull Back Rally continuation with recent top formation at 17344.60 on 17-03-2022
6- Stochastic- %K(5) both lines are kissing in Over bought zone.
7- Stochastic:- %K(5)- 87.62 & %D(3)- 87.74.
8- In MACD- MACD line has intersected Average line upward and its both lines are rising in negative zone.
9- MACD(26,12)- -214.37 & EXP(9)- -450.59 & Divergence- 236.22
Conclusions from EOD chart analysis
(Stochastic & MACD)
Pull Back Rally continuation strongly after Wave-C recent bottom formation at 15671.5 and no indication of on going Pull Back Rally completion yet on EOD and intraday charts.
As MACD line has intersected Average line upward and its both lines are rising in negative zone therefore showing Upward trend formations but in Stochastic its both lines are kissing in Over bought zone therefore signalling Short Term correction beginning possibility also.
Nifty-EOD Chart Analysis
(Averages)
Nifty-EOD Chart (17-Mar-2022):-

Technical Patterns and Formations in EOD charts
1-Averages
A- 5-Day SMA is today at 16885
B- 21-Day SMA is today at 16740
C- 55-Day SMA is today at 17278
D- 100-Day SMA is today at 17380
E- 200-Day SMA is today at 16997
Conclusions from EOD chart
analysis (Averages)
As Nifty closed above all Averages except 100-Day SMA(17380) at 17287.05 on 17-03-2022 therefore showing strength because closed well above Long Term Trend decider 200-Day SMA(16997),let Nifty to sustain above it then rally above life time highest will be considered after Wave-C completion confirmation at 15671.5.
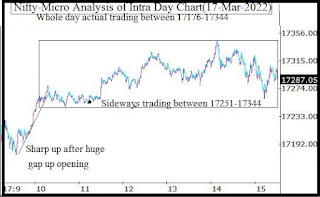
Nifty-Intra Day Chart Analysis
(17-Mar-2022)
Nifty-Intra Day Chart (17-Mar-2022):-
Technical Patterns formation in today intraday charts
1- Sharp up after huge gap up opening
2- Sideways trading between 17251-17344
3- Whole day actual trading between 17176-17344
Conclusions from intra day chart analysis
Although firstly sharp up after huge gap up opening but sideways trading was seen between 17251-17344 in last more than 4 hours therefore firstly sustaining beyond this range should be watched in the beginning of coming week for next decisive moves beginning.
As selling patterns were not seen and consolidation patterns formations between 17251-17344 therefore firstly up moves are expected and complete selling is required for slipping and sustaining below 17251,let it happen then decisive down moves will be seen.
Conclusions
(After putting all studies together)
1- Short Term Trend is up.
2- Intermediate Term Trend is sideways.
3- Long Term Trend is sideways.
Although Short Term Trend is up but no confirmation of sustaining above 55 & 200-Day SMA therefore Intermediate & Long Term Trends will be considered sideways,let sustaining above both these SMA confirmation come then then these 2 Trends will be up.
MACD is showing Upward trend formations but in Stochastic its both lines are kissing in Over bought zone therefore signalling Short Term correction beginning possibility. As intraday charts have not shown selling patterns formations therefore on going Pull Back Rally will remain continued towards following next resistances in the beginning of next week:-
1- 17370-17417
2- 17580-17639
3- 17648-17684
4- 17699-17731
5- 17736-17761
Next supports of Nifty are as follows:-
1- 17185-17220
2- 16838-16943
3- 16559-16672
Firstly watch next resistances and failing to sustain above any one will confirm Short Term correction beginning towards above mentioned supports. More or less sideways market is expected within above mentioned supports and resistances if there is no big negative news from Russia-Ukraine war front.