

17213-17622 will confirm next Short Term trend
Nifty-Intra Day Chart Analysis &
Market Outlook(22-09-2021)
Nifty-Intra Day Chart (21-Sep-2021):-
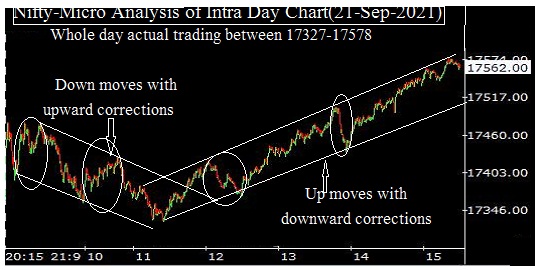
Technical Patterns formation in today intraday charts
1- Down moves with upward corrections
2- Up moves with downward corrections
3- Whole day actual trading between 17327-17578
Conclusions from intra day chart analysis
Although firstly 70 points down moves with upward corrections but getting supports just above yesterday mentioned 1st supports range(17280-17305) and after that last 4 hours up moves with downward corrections and closing as well as today highest formations within yesterday selling range(17512-17622).
As Nifty has honoured both immediate supports and resistances therefore expected that Nifty will again trade between immediate supports and resistances(17213-17622) as well as prepare for next decisive moves beyond this range. Finally sustaining beyond/forceful break out of 17213-17622 will confirm next Short Term trend hence should be watched in the coming sessions.