Forceful break down will confirm deeper correction and break out will generate 1st signal of up moves beginning
Technical Analysis,Research & Weekly Outlook
(Apr 26 to Apr 30,2021)
Nifty-EOD Chart Analysis
(Corrective Waves)
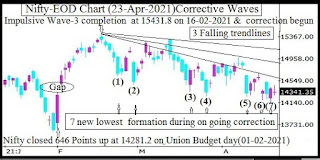
Nifty-EOD Chart (23-Apr-2021):-
Technical Patterns and Formations in EOD charts
1- Nifty closed 646 Points up and closed at 14281.2 on Union Budget day(01-02-2021).
2- 132 Points gap support formation between 14337-14469 on 02-02-2021
3- Impulsive Wave-3 completion after new life time top formation at 15431.8 on 16-02-2021 and correction begun.
4- Corrective Wave-4 continuation with recent bottom formation at 14151.4 on 22-04-2021 and 7 new lowest formation in this correction.
A- 14635.0 on 22-02-2021 (1)
B- 14467.8 on 26-02-2021 (2)
C- 14350.1 on 19-03-2021 (3)
D- 14264.4 on 25-03-2021 (4)
E- 14248.7 on 12-04-2021 (5)
F- 14191.4 on 19-04-2021 (6)
G- 14151.4 on 22-04-2021 (7)
5- 3 Falling trendlines
6- Gap of 02-02-2021(14337-14469) has been filled up after Nifty moving below 14337 on 25-03-2021.
7- Post Budget day 54 sessions sideways trading between 14152-15431 from 02-02-2021 to 23-04-2021.
Conclusions from EOD chart analysis
(Corrective Waves)
As Nifty closed at 14281.2 on Union Budget day(01-02-2021) after gaining 646 Points and on next day 132 Points gap support formation between 14337-14469 also therefore impulsive Wave-3 remained continued.
Impulsive Wave-3 completed after new life time top formation at 15431.8 on 16-02-2021 corrective Wave-4 started which is in continuation with recent bottom formation at 14151.4 on 22-04-2021.
Although extreme panic due to sharp rise of Corona cases in India but 2020 like crashing situation was not seen and Corrective Wave-4 is being seen through 7 times new lowest with little new down moves during this correction.
As Corrective Wave-4 continuation and forceful break down is not being seen as well as down moves are slow therefore following patterns and levels should be watched in the coming weeks for next big moves confirmations:-
1- Sustaining above 3 Falling trend lines one by one will be strong indication of correction completion and confirmation will be sustaining above 15431.
2- Forceful break down of last 54 sessions lowest(14152) will be strong indication of deeper correction beginning.
Nifty-Last 11 Sessions intraday charts analysis
Nifty-Intra Day Chart (Apr 07 to Apr 23,2021):-
Technical Patterns formation in last 11 Sessions intraday charts
1- Selling(Resistances) in last 11 Sessions are as follows:-
A- 14354-14466
B- 14486-14509
C- 14528-14559
D- 14649-14697(Strong resistances)
E- 14698-14785(Gap resistances)
F- 14821-14970
2- Consolidation(Supports) in last 11 Sessions are as follows:-
A-14316-14354
B- 14192-14294
3- 11 Sessions actual trading between 14152-14984
Conclusions from 11 Sessions intra day chart analysis
Last 54 sessions trading between 14152-15431 and Nifty is trading at lower levels of this range below 15000 between 14152-14984 for the last 11 sessions.
Certainly there are multiple resistances above 15000 and above mentioned 6 resistances are also lying between 14354-14970 but above mentioned 2 supports are also between 14192-14354.
As strong resistances at higher levels and lower levels comparatively much weaker supports therefore in fresh selling develops in next week then huge down moves will be seen subject to the condition of forceful breaking down of last 11 sessions trading range lowest(14152).
Nifty-Intra Day Chart Analysis(23-Apr-2021)
Nifty-Intra Day Chart (23-Apr-2021):-
Technical Patterns formation in today intraday charts
1- Consolidation in first hour between 14324-14354
2- Up moves with downward corrections
3- Selling between 14396-14461
4- Selling between 14354-14388
5- Volatility in last hour between 14274-14359
6- Whole day actual trading between 14274-14461
Conclusions from intra day chart analysis
Although weaker opening last Friday but consolidation developed therefore up were seen which were with downward corrections hence remain continued.
As higher levels selling in Mid-session and again follow up selling after slipping from higher levels therefore sharp down moves below intraday lowest were seen.
85 points volatility in last hour was seen in which following points were observed:-
1- Lower levels supports were seen.
2- Last hour volatility(14274-14359) was below and above first hour consolidation range(14324-14354)
As lower levels supports and higher levels selling was seen last Friday therefore Nifty will firstly trade and prepare for next decisive moves within and near about last Friday trading range(14274-14461) as well as sustaining it beyond will generate first indication of next decisive moves beginning.
Conclusions (After Putting All Studies Together)
1- Long Term Trend is up.
2- Intermediate Term Trend is sideways between 14152-15421 for the last 54 sessions.
3- Short Term Trend is sideways between 14152-14697 for the last 8 sessions.
Corrective Wave-4 continuation and no indication of its completion yet. Although more than 3 times Corona cases this time in compassion to 2020 Corona cases but crashing like situation is not being seen and Wave-4 correction is without required force therefore supports getting at lower levels can not be ruled out.
Nifty sideways trading ranges are as follows:-
1- Last 8 sessions trading between 14152-14697.
2- Last 24 sessions trading between 14152-14984.
3- Last 54 sessions trading between 14152-15431.
As 14152 is lowest of all 3 trading ranges and no immediate strong supports below it therefore its forceful break down will confirm deeper correction. Multiple resistances are lying above last Friday closing(14341.35) and up to 15431 therefore complete consolidation is required for fresh rally above it.
As immediate supports and resistances are lying between last 8 sessions trading range(14152-14697) and Nifty will have to trade and prepare for next decisive moves within this range therefore its preparation will be done in next week. Finally forceful break down of 14152 will confirm deeper correction and sustaining above 14697 will confirm first signal of next up moves beginning therefore should be firstly watched for its confirmations in next week.


