

Firstly watch next supports for
the life of on going correction
Technical Analysis,Research & Weekly Outlook
(Feb 22 to Feb 26,2021)
Live Proofs of our accuracy
Following lines were told in previous Weekly Outlook on 13-02-2021 in "Firstly watch levels amid Short term correction possibility"
1- Short term correction possibility below 14977
2- sustaining below 14977 will mean correction beginning towards following supports:-
1- 14811-14913
2- 14717-14765
3- 14504-14615
As was told 100% same happened and:-
1- Topic name was "Short term correction possibility" and continuous down moves were seen in last 4 sessions as well as previous weekly closing was negative.
2- Short term correction was seen below 14977 last Friday.
3- Nifty got supports last Friday within above mentioned 1st supports range(14811-14913) at 14898.20 .
"Short term correction possibility" was told on 13-02-2021 & previous weekly closing was negative after last 4 sessions down moves.


Nifty-Weekly Analysis (Waves structure)
Nifty-Weekly Chart (19-Feb-2021):-

Technical Patterns and Formations in EOD charts
1- Corrective Wave-C completion and Impulsive Wave-1 beginning from 7511.10 on 24-03-2020
2- Impulsive Wave-1 completion at 11794.30 on 31-08-2020 and corrective Wave-2 beginning
3- Corrective Wave-2 completion at 10790.20 on 24-09-2020 and Impulsive Wave-3 beginning
4- Impulsive Wave-3 completion indications after new life time highest top formation at 15431.8 on 16-02-2021
5- Bearish Engulfing weekly candle formation in previous week.
Conclusions from Weekly chart analysis(Waves structure)
Impulsive Wave-3 completion indications after new life time highest top formation at 15431.8 on 16-02-2021 because Bearish Engulfing weekly candle formation in previous week.
Nifty-EOD Chart Analysis
(Averages & Stochastic)
Nifty-EOD Chart (19-Feb-2021):-
Technical Patterns and Formations in EOD charts
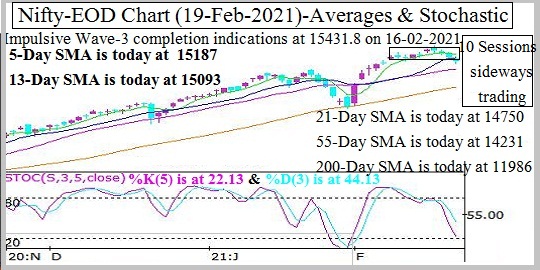
1- Impulsive Wave-3 completion indications after new life time highest top formation at 15431.8 on 16-02-2021
2-Averages
A- 5-Day SMA is today at 15187
B- 13-Day SMA is today at 15093
C- 21-Day SMA is today at 14750
D- 55-Day SMA is today at 14231
E- 200-Day SMA is today at 11986
3- 10 Previous sessions sideways trading between 14977-15431
4- 10 Sessions trading range broken down on 19-02-2021
5- Stochastic- %K(5) is at 22.13 & %D(3) is at 44.13
6- %K(5) has intersected downward %D.
Conclusions from EOD chart analysis
Averages & Stochastic)
10 Previous sessions sideways trading between 14977-15431 and this range was forcefully broken down on 19-02-2021 but closing was within it at 14981.75 therefore breaking down confirmation is still required.
As previous weekly closing was below 5-Day and 13-Day SMA therefore indications of Wave-3 completion at 15431.8 on 16-02-2021.
%K(5) has intersected downward %D in Stochastic and and both lines are moving down towards Oversold zone therefore indications of more down moves in next week.
Nifty-Last 10 Sessions intraday charts analysis
Nifty-Intra Day Chart (Feb 08 to Feb 19,2021):-

Technical Patterns formation in last 10 Sessions intraday charts
1- Selling(Resistances) in last 10 Sessions are between:-
A- 15031-15144
B- 15213-15245
C- 15274-15315
D- 15335-15431
2- 10 Sessions sideways trading between 14977-15431
3- 10 Sessions trading range broken down on 19-02-2021
Conclusions from 10 Sessions
intra day chart analysis
As good selling in last 4 sessions therefore 10 previous sessions sideways trading range(14977-15431) was forcefully broken down on 19-02-2021 but closing was within it at 14981.75 therefore its breaking down confirmation is still required.
Sustaining below 14977 will mean last 10 sessions trading range breaking down confirmation and that will mean more decisive down moves therefore should be firstly watched in next week.
Nifty-Intra Day Chart Analysis
(19-Feb-2021)
Nifty-Intra Day Chart (19-Feb-2021):-

Technical Patterns formation in today intraday charts
1- Selling between 15031-15144
2- Sharp fall
3- Down moves in Bullish Falling Channel
4- Sharp up
5- Whole day actual trading between 14899-15144
Conclusions from intra day chart analysis
As more than 4 hours selling between 15031-15144 therefore sharp fall was seen but after that some consolidation at lower levels through Down moves in Bullish Falling Channel hence sharp up moves in last half hour.
Firstly sustaining beyond last Friday lowest(14899) should be watched in the beginning of next week because some consolidation was seen above it last Friday and once its breaking down confirmation will mean more decisive down moves beginning towards next supports.
Conclusions (After Putting All Studies Together)
1- Long Term Trend is up.
2- Intermediate Term Trend is up.
3- Short Term Trend is sideways between 14977-15257 and will be down after sustaining below 14977.
As following reasons therefore more down moves are expected in next week:-
1- Higher levels good intraday selling in last 4 sessions and only minor consolidation at lower levels last Friday
2- Previous weekly closing was below 13-Day SMA which is a weakness indication
3- Stochastic indicator has not turned over sold and its both lines are moving down towards it
More down moves expectations in next week and once sustaining below last 10 sessions lowest(14977) will mean 10 sessions trading range breaking down confirmation which will open the doors of correction continuation towards following those next supports which were posted in previous weekly Outlook also:-
1- 14811-14913
2- 14717-14765
3- 14504-14615
As Nifty got support within above mentioned 1st supports range(14811-14913) at 14898.20 last Friday therefore firstly sustaining it beyond and after that sustaining beyond next 2 supports ranges should be watched one by one in next week for the life of on going correction.