

Firstly watch 11244 amid rally continuation expectations
Nifty-Intra Day Chart Analysis &
Market Outlook(22-07-2020)
Nifty-Intra Day Chart (21-Jul-2020):-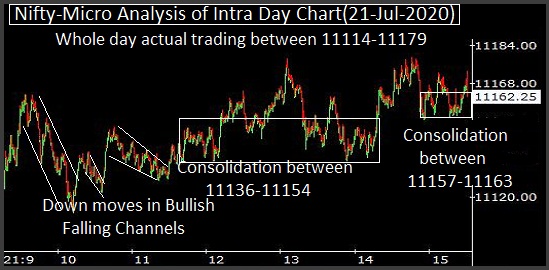 |
| Just click on chart for its enlarged view |
1- Down moves in Bullish Falling Channel
2- Consolidation between 11136-11154(Immediate Supports)
3- Consolidation between 11157-11163
4- Whole day actual trading between 11114-11179
Conclusions from intra day chart analysis
Following lines were told on 18-07-2020 in "Finally Rally towards next resistances ":-
100.0% Fibonacci Extension Target of Wave-B is at 11184.70 and and rally continuation is expected towards and just above it in next week.
Rally continuation was told towards 11184.70 and today highest was just below it at 11,179.55.
As good intraday consolidation and no selling pattern formations today therefore rally will remain continued towards 11244 but sustaining above it should be firstly watched in the coming sessions because:-
1- Gap resistances are between 11036-11244.
2- Multiple resistances are lying above 11244.
3- Short Term indicators are about to be Overbought.