

Just Watch 2 levels for first signal and confirmation of Short Term Correction
Nifty-Intra Day Chart Analysis &
Market Outlook(15-12-2020)
Nifty-Intra Day Chart (14-Dec-2020):-
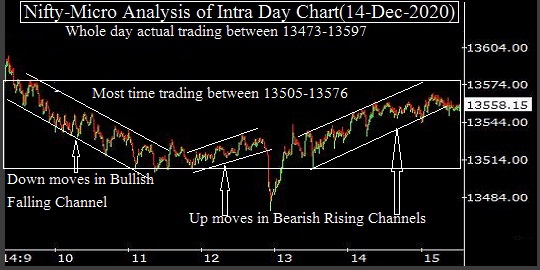
Technical Patterns formation in today intraday charts
1- Most time trading between 13505-13576
2- Down moves in Bullish Falling Channel
3- Up moves in Bearish Rising Channels
4- Whole day actual trading between 13473-13597
Conclusions from intra day chart analysis
As Dow Jones Futures was trading more than 190 points up at the time of Indian Stock markets opening therefore strong opening but not sustaining at higher levels because good selling was seen between 13542-13579 last Friday and Nifty most time traded within and below yesterday selling range between 13505-13576 as well as closed within it at 13558.15 today.
Selling was seen between 13525-13548 on 09-12-2020 also which means that 3 out of 4 previous sessions good selling has been developed between 13505-13579 but some consolidation also today within this range through Down moves in Bullish Falling Channel therefore valid break out of this range will generate strong signal of next big decisive move.
As overbought indicators have started to show negative divergence on EOD charts and intraday charts are also showing selling patterns formations therefore Short Term Correction is expected and its first signal will be valid break down of 13505 as well as confirmation will be sustaining below 13400.
Just Watch above 2 levels for first signal and confirmation of Short Term Correction which may be deeper also.