

Finally sharp down after follow up selling
Nifty-Intra Day Chart Analysis &
Market Outlook(17-09-2020)
Nifty-Intra Day Chart (16-Sep-2020):-
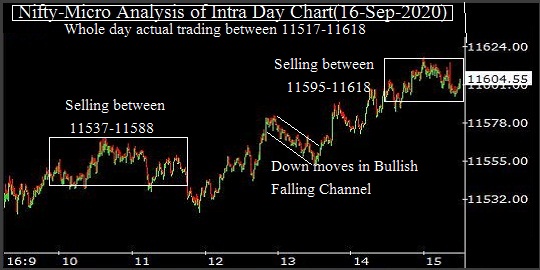
Technical Patterns formation in today intraday charts
1- Selling between 11537-11588
2- Down moves in Bullish Falling Channel
3- Selling between 11595-11618
4- Whole day actual trading between 11517-11618
Conclusions from intra day chart analysis
Although today closing was at the top of the day but selling patterns were also seen 2 times and little consolidation was through in Mid-session through Down moves in Bullish Falling Channel.
As soon as Dow Jones Futures started to move up and good opening of European markets also therefore Indian markets also have recovered.
As Short Term indicators are Over bought and selling patterns are also being seen as well as only positive sentiments drives up moves therefore finally sharp down moves will be seen in the coming 1/2 sessions after follow up selling.