Firstly watch level in next week for the life and length of expected correction
Technical Analysis,Research & Weekly Outlook
(Feb 10 to Feb 14,2020)
Nifty-EOD Chart Analysis
(5th Wave structure)
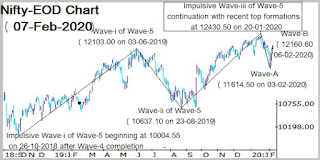
Nifty-EOD Chart (07-Feb-2020):- |
| Just click on chart for its enlarged view |
1- Impulsive Wave-i of Wave-5 beginning at 10004.55 on 26-10-2018 after Wave-4 completion
2- Wave-i of Wave-5 completion at 12103.00 on 03-06-2019 and corrective Wave-ii beginning
3- Corrective Wave-ii of Wave-5 completion at 10637.10 on 23-08-2019 and impulsive Wave-iii beginning
4- Impulsive Wave-iii of Wave-5 continuation with recent top formations at 12430.50 on 20-01-2020
5- Wave-A completion at 11614.50 on 03-02-2020
6- Wave-B completion at 12160.60 on 06-02-2020
Nifty-Intra Day Chart Analysis
(07-Feb-2020)
Nifty-Intra Day Chart (07-Feb-2020):- |
| Just click on chart for its enlarged view |
1- Selling between 12104-12136
2- Selling between 12098-12108
3- Selling between 12096-12113
4- Whole day actual trading between 12074-12154
Conclusions from EOD chart analysis
1- Long Term Trend is up after moving above its decider 200 Day SMA(today at 11663.40)
2- Intermediate Term Trend sideways.
3- Short Term Trend has turned up after last week rally.
Conclusions from intra day chart analysis
As higher levels good selling therefore down moves below last Friday lowest(12073.95) is expected in the beginning of next week.
Conclusions (After Putting All Studies Together)
Following lines were told on 01-02-2020 in "Strong rally after Global markets recovery from Corona virus fear":-
27.0% retracement has been completed and Short Term Indicators have also turned Oversold therefore some up moves towards following resistances can not be ruled out and until Nifty will sustain above 12216 till then correction completion will not be considered.
1- 11808-111842
2- 11900-12017
3- 12003-12048
4- 12125-12169
5- 12160-12216
Strong rally was seen in previous week which completed near the top of above mentioned 4th resistance at 12160.60 on 06-02-2020.
Next and last 2 resistances above 12216 are as follows:-
1- 12220-12262
2- 12317-12378
Although strong rally in first 3 sessions of previous week but some selling was also seen at higher levels in last 2 sessions between 12096-12160 as well as Short Term Indicators have turned over bought therefore down moves are firstly expected in th ebeginning of next week.
As above mentioned multiple resistances are also lying above last week highest therefore until complete consolidation will not develop till then fresh rally above life time highest will not be seen and follow up selling in the beginning of next week will mean correction continuation towards the bottom of Wave-A(11614.50).
Next supports below last Friday lowest are as follows:-
1- 11983-12021
2- 11922-11951
3- 11615-11705
Follow up selling and correction continuation below 11922 will mean Wave-C formation for moving below the bottom of Wave-A(11614.50) therefore sustaining beyond 11922 should be firstly watched in next week for the life and length of expected correction.

