

Intra Day Chart Analysis & Market Outlook(28-07-2016)
Nifty-Intra Day Chart (27-Jul-2016):-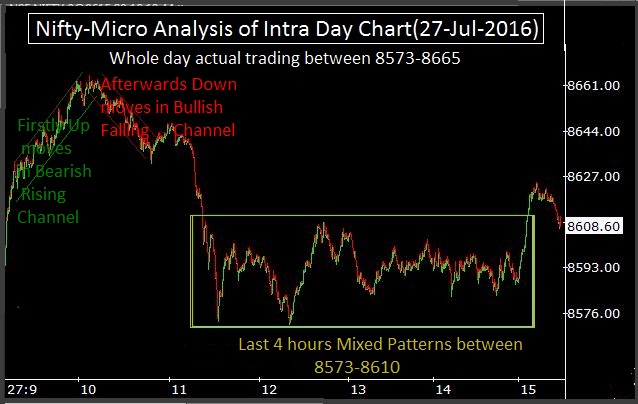 |
| Just click on chart for its enlarged view |
1- Firstly Up moves in Bearish Rising Channel
2- Afterwards Down moves in Bullish Falling Channel
3- Last 4 hours Mixed Patterns between 8573-8610
4- Whole day actual trading between 8573-8665
Conclusions from intra day chart analysis
Following lines were told yesterday in "Intra Day Chart Analysis & Market Outlook(27-07-2016)":-
1- fresh selling was seen today between 8634-8644 which is within previous sessions updated resistance range(8575-8652).
2- As follow up selling within mentioned resistance range(8575-8652) and it has become stronger today
Although strong up moves immediately after opening but not sustaining at higher levels because follow up selling within resistance range was seen yesterday. As only intraday volatility and as such one sided technical position not formations therefore next decisive moves confirmations will be from vaild break out of 8444-8665 which should be firstly watched in the coming sessions.