

Nifty-Intra Day Chart (07-Apr-2014):-
Technical Patterns and Formations in today intraday charts
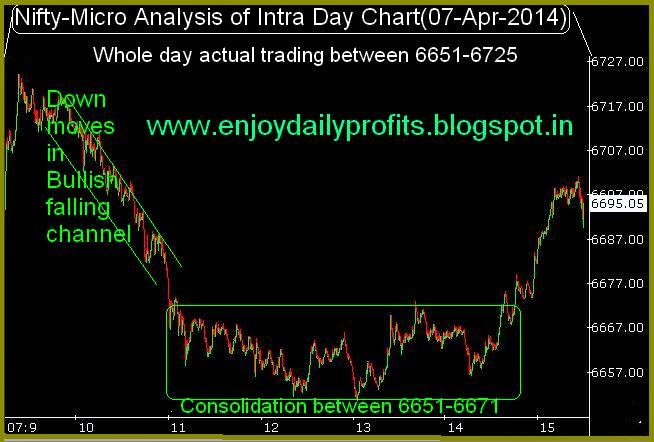
1- Down moves in Bullish falling channel.
2- Consolidation between 6651-6671
3- Whole day actual trading between 6651-6725
Firstly down moves in Bullish falling channel and after that 3 hours consolidation with lower levels good supports also therefore up moves are expected in the coming sessions.
All trends are up,indicators are over bought and shown negative divergence as well therefore minimum Short Term Correction is due but complete follow up selling is must for any deeper correction
Lower levels consolidation and higher levels selling between 6663-6776 in previous week and good consolidation was seen 6651-6671 on 07-04-2014 therefore until Nifty will not sustain below 6651 after complete selling till then next decisive down moves will not be considered.
Although indicators are over bought and shown negative divergence also but Indian markets most Bullish and up moves may remain continued after correction completion in sideways moves or very Short Term correction. Expected that Nifty will trade and prepare for next trend between 6651-6776 and sustaining beyond this range will next trend confirmation.
 |
| Just click on chart for its enlarged view |
1- Down moves in Bullish falling channel.
2- Consolidation between 6651-6671
3- Whole day actual trading between 6651-6725
Conclusions from intra day chart analysis
Firstly down moves in Bullish falling channel and after that 3 hours consolidation with lower levels good supports also therefore up moves are expected in the coming sessions.
All trends are up,indicators are over bought and shown negative divergence as well therefore minimum Short Term Correction is due but complete follow up selling is must for any deeper correction
Lower levels consolidation and higher levels selling between 6663-6776 in previous week and good consolidation was seen 6651-6671 on 07-04-2014 therefore until Nifty will not sustain below 6651 after complete selling till then next decisive down moves will not be considered.
Although indicators are over bought and shown negative divergence also but Indian markets most Bullish and up moves may remain continued after correction completion in sideways moves or very Short Term correction. Expected that Nifty will trade and prepare for next trend between 6651-6776 and sustaining beyond this range will next trend confirmation.