

Rally continuation
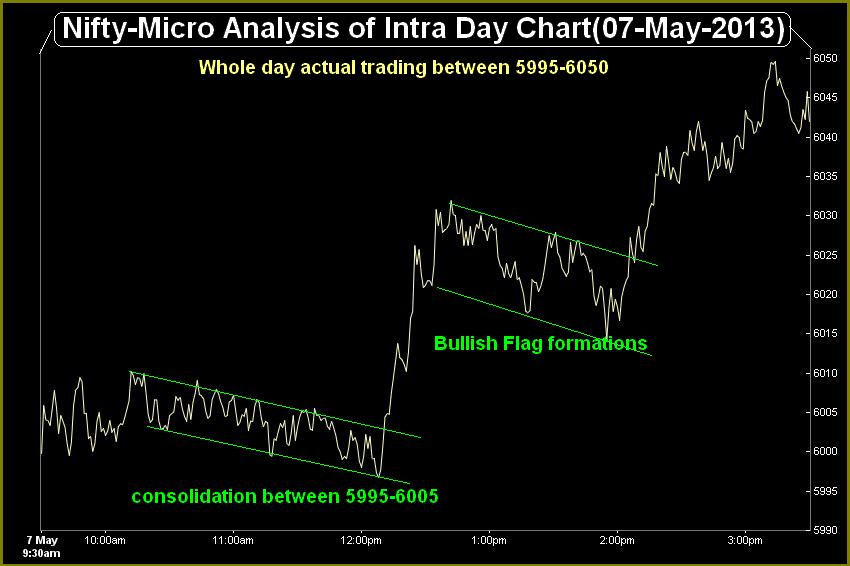
Nifty-Intra Day Chart (07-May-2013):-
 |
| Just click on chart for its enlarged view |
1- First 3 hours lower levels consolidation between 5995-6005.
2- Bullish Flag formations.
3- Whole day actual trading between 5995-6050
Conclusions from intra day chart analysis
Sentiment is heated and indicators are over bought therefore intraday corrections can not be ruled out. As Many times Bullish markets completes correction in range bound mode or after higher levels consolidations also therefore only such type of minor corrections will be considered at this moment because no selling seen today and complete selling patterns are required for decisive down moves or deeper correction.
Although negative news flow form Parliament today but Indian markets showed whole day up moves after first 3 hours lower levels consolidations and Bullish Flag formations in the Mid session therefore rally continuation is expected in the coming sessions.
Next strong resistances are between 6050-6105 and market requires complete follow up consolidations for crossing and sustaining above it therefore slow up moves within this range and coming 1/2 sessions trading within it is possible. As no harm to on going rally yet therefore up moves will be seen within and above mentioned resistances range(6050-6105).