

Nifty-EOD Chart (11-Sep-2012):-
Technical Patterns and Formations in EOD charts
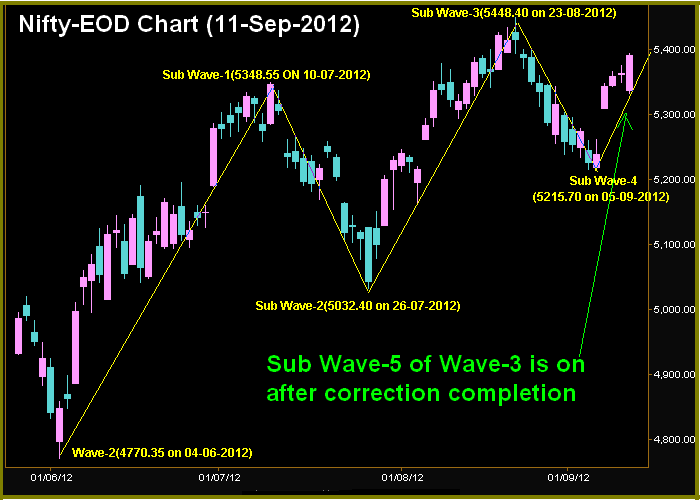
1- Wave-2(4770.35 on 04-06-2012)
2- Sub Wave-1(5348.55 ON 10-07-2012)
3- Sub Wave-2(5032.40 on 26-07-2012)
4- Sub Wave-3(5448.40 on 23-08-2012)
5- Sub Wave-4(5215.70 on 05-09-2012)
6- Sub Wave-5 of Wave-3 is on after correction completion
Sub Wave-5 of Wave-3 is on after correction completion but intraday selling between 5362-5373 was seen on 10-Sep-2012 therefore firstly negative zone trading was seen yesterday. Intraday supports at lower levels and after that more than 1 hour trading above 5373 was seen yesterday therefore on going rally(Sub Wave-5 of Wave-3) continuation possibilities turned higher yesterday.
As strong resistances between 5380-5450 therefore complete consolidations is required for rally above 5450 and up moves may be slow also but expected that finally rally will be seen above 5450 .
 |
| Just click on chart for its enlarged view |
1- Wave-2(4770.35 on 04-06-2012)
2- Sub Wave-1(5348.55 ON 10-07-2012)
3- Sub Wave-2(5032.40 on 26-07-2012)
4- Sub Wave-3(5448.40 on 23-08-2012)
5- Sub Wave-4(5215.70 on 05-09-2012)
6- Sub Wave-5 of Wave-3 is on after correction completion
Conclusions from EOD chart analysis
Sub Wave-5 of Wave-3 is on after correction completion but intraday selling between 5362-5373 was seen on 10-Sep-2012 therefore firstly negative zone trading was seen yesterday. Intraday supports at lower levels and after that more than 1 hour trading above 5373 was seen yesterday therefore on going rally(Sub Wave-5 of Wave-3) continuation possibilities turned higher yesterday.
As strong resistances between 5380-5450 therefore complete consolidations is required for rally above 5450 and up moves may be slow also but expected that finally rally will be seen above 5450 .