

Technical Analysis,Research & Weekly Outlook
(Apr 23 to Apr 27,2012)
Nifty-EOD Chart (20-Apr-2012):-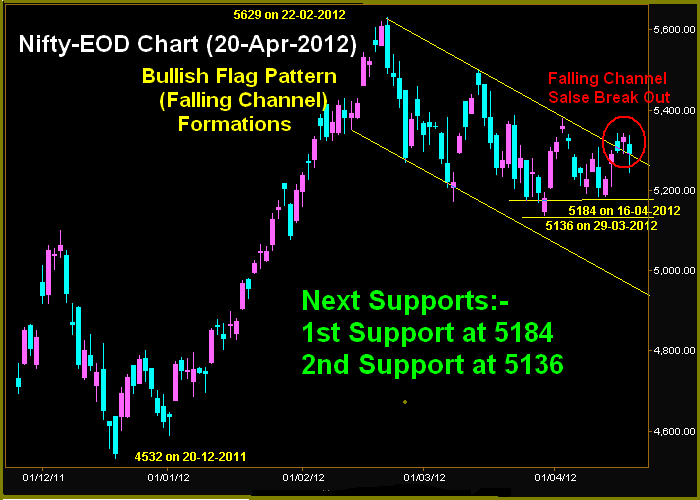 |
| Just click on chart for its enlarged view |
1- Bullish Flag Pattern(Falling Channel) in on going Correction
2- Bullish Flag Pattern(Falling Channel) Formations
3- Falling Channel false Break Out
4- 1st Support at 5184
5- 2nd Support at 5136
Conclusions from EOD chart analysis
Falling Channel false Break Out was technically most crucial formation of previous week and firstly its impact will be seen in next week through more down moves
Nifty-Intra Day Chart (Apr 18 to Apr 20,2012):-
 |
| Just click on chart for its enlarged view |
1- Genuine selling between 5330-5341 on 18-04-2012.
2- Mixed Patterns(selling also) between 5325-5338 on 19-04-2012
3- Almost 5 hours genuine selling between 5318-5336 on 20-04-2012
Nifty-Intra Day Chart (20-Apr-2012):-
 |
| Just click on chart for its enlarged view |
1- Almost 5 hours genuine selling between 5318-5336
2- Sharp 70 points crash in 7 minutes.
3- Whole day trading between 5246-5336.
Conclusions from intra day charts analysis
Although 70 Points crash after 02:20 PM but we clearly projected selling at 10:47:00 AM in Post-open Outlook(20-04-2012). Almost 5 hours genuine selling between 5318-5336 therefore market require complete consolidations for any move above 5336.
Sharp 70 points crash in 7 minutes on 20-04-2012 after 3 sessions selling and specially almost 5 hours genuine selling on 20-04-2012 therefore market requires complete consolidations for any move above 5336. Until complete consolidations will not happen minimum on intraday charts till then any rally above 5336 will not be considered.
As almost 5 hours huge selling is proved through genuine intraday selling patterns on 20-04-2012 therefore more down moves are expected in the coming sessions.
Conclusions (After Putting All Studies Together)
Corretion is on in Falling Channel and market crashed after forming 3rd lower top in last week therefore technical possibility of fresh bottom below 5136 should be kept in mind. In this regard following topic with EOD Chary was posted on 15-04-2012
Lower Tops and Lower Bottoms Formation In On Going Correction
(Just click above topic link and go through)
As third time resistance at falling trend line as well as 3 days intraday selling patterns near about it therefore sharp fall seen last Friday and more down moves as well as testing of above mentioned next supports are possible in the coming week.
correction completion confirmations will be after sustaining above 5341 and Nifty will firstly trade between 5175-5318 in the beginning of next week. Firstly sideways market within 5136-5341 and sustaining it beyond will give next trend confirmations.