

Nifty-Intra Day Chart (Dec 19 & Dec 20,2012):-
Technical Patterns and Formations in last 2 Sessions intraday charts
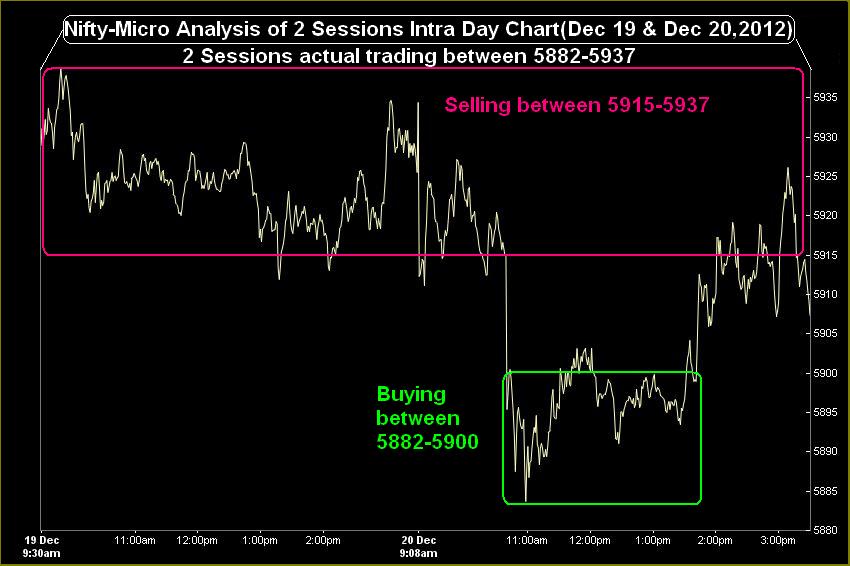
1- Selling between 5915-5937
2- Buying between 5882-5900
3- 2 Sessions actual trading between 5882-5937
Sub Wave-5 of Wave-3 continuation with upward Long and Intermediate term trends but sideways Short term trend for the last 15 sessions between 5823-5965. As 15 sessions sideways market therefore its valid break out will have sufficient strength to decide next strong moves,technical positions of last 15 sessions are as follows:-
1- Strong supports are between 5839-5860.
2- Strong resistances are between 5915-5965.
Pre-open Outlook(21-12-2012)
As Dow's Futures is 188 points down and all the Asian markets are in Red therefore sentiment is weak today morning and gap down opening will be seen in Indian markets. Nifty will firstly trade and prepare for next moves between 5860-5915 today because strong resistances above and strong supports below this range.
As Long and Intermediate term trends are up and Indian markets are Bullish therefore expected that finally 15 sessions range valid break out will be seen above 5965 but market will take its own time and will trade some more sessions between 5823-5965.
 |
| Just click on chart for its enlarged view |
1- Selling between 5915-5937
2- Buying between 5882-5900
3- 2 Sessions actual trading between 5882-5937
Conclusions from 2 Sessions intra day chart analysis
Sub Wave-5 of Wave-3 continuation with upward Long and Intermediate term trends but sideways Short term trend for the last 15 sessions between 5823-5965. As 15 sessions sideways market therefore its valid break out will have sufficient strength to decide next strong moves,technical positions of last 15 sessions are as follows:-
1- Strong supports are between 5839-5860.
2- Strong resistances are between 5915-5965.
Pre-open Outlook(21-12-2012)
As Dow's Futures is 188 points down and all the Asian markets are in Red therefore sentiment is weak today morning and gap down opening will be seen in Indian markets. Nifty will firstly trade and prepare for next moves between 5860-5915 today because strong resistances above and strong supports below this range.
As Long and Intermediate term trends are up and Indian markets are Bullish therefore expected that finally 15 sessions range valid break out will be seen above 5965 but market will take its own time and will trade some more sessions between 5823-5965.