

Nifty-Intra Day Chart (24-Dec-2012):-
Technical Patterns and Formations in today intraday charts
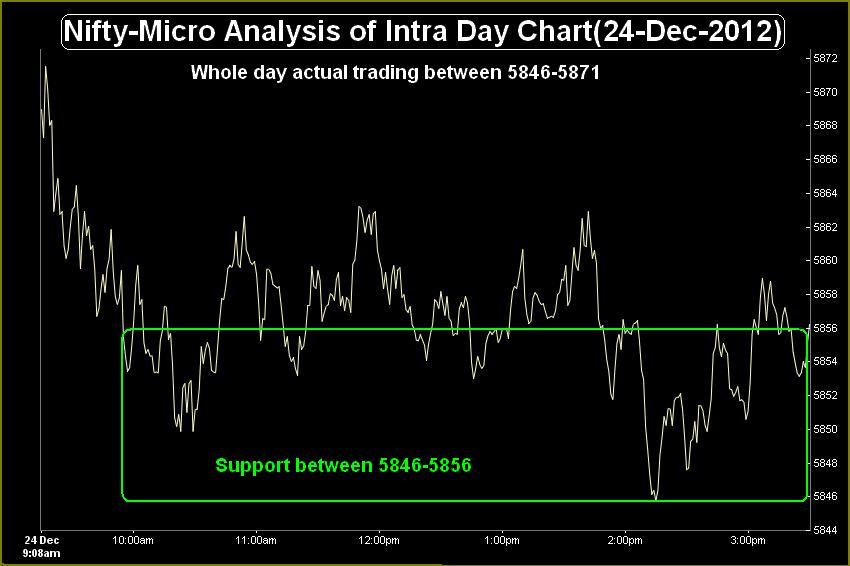
1- Support between 5846-5856
2- Whole day actual trading between 5846-5871
Lower levels supports with intraday consolidation patterns therefore fresh up move hopes turned alive on 24-12-2012 but good selling at higher levels and development of strong multiple resistances also in last 16 sessions sideways trading therefore follow up complete consolidation is required in the coming sessions and sustaining beyond next first resistance range(5868-5882) will be fresh up moves confirmation.
Long Term Trend is up,Short Term is down and Intermediate Term is sideways between(5823-5965) for the last 16 sessions with lower levels supports and higher levels resistances. Indian markets are not prepared for any side decisive trend and will firstly trade within 5823-5965. Follow up moves and valid break out of following ranges should be firstly watched for:-
1- Next trend first strong indication 5846-5882
2- Next trend first confirmations 5823-5965
 |
| Just click on chart for its enlarged view |
1- Support between 5846-5856
2- Whole day actual trading between 5846-5871
Conclusions from intra day chart analysis
Lower levels supports with intraday consolidation patterns therefore fresh up move hopes turned alive on 24-12-2012 but good selling at higher levels and development of strong multiple resistances also in last 16 sessions sideways trading therefore follow up complete consolidation is required in the coming sessions and sustaining beyond next first resistance range(5868-5882) will be fresh up moves confirmation.
Long Term Trend is up,Short Term is down and Intermediate Term is sideways between(5823-5965) for the last 16 sessions with lower levels supports and higher levels resistances. Indian markets are not prepared for any side decisive trend and will firstly trade within 5823-5965. Follow up moves and valid break out of following ranges should be firstly watched for:-
1- Next trend first strong indication 5846-5882
2- Next trend first confirmations 5823-5965