

Nifty-Intra Day Chart (26-Sep-2012):-
Technical Patterns and Formations in today intraday charts
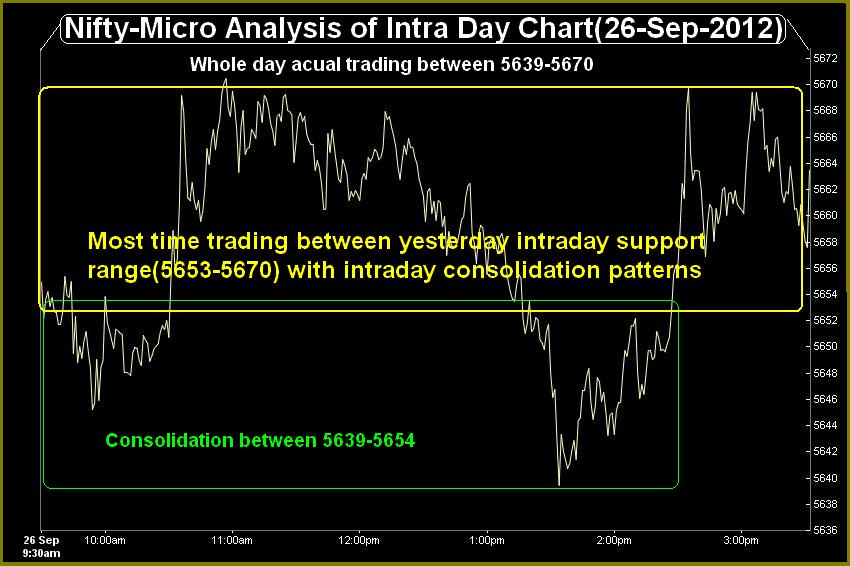
1- Consolidation between 5639-5654
2- Most time trading between yesterday intraday support range(5653-5670) with intraday consolidation patterns.
3- Whole day acual trading between 5639-5670.
Although all the Global markets were .55% to 2% down today and Nifty slipped also below yesterday intraday support range(5653-5670) but Nifty could not sustain below 5653 and recovered after getting support between 5639-5654.
As Nifty traded most time between above mentioned yesterday intraday support range(5653-5670) with intraday consolidation patterns and intraday supports at lower levels also today therefore high possibility of rally continuation after correction completion today.
Next trend confirmation range is 5639-5709.
 |
| Just click on chart for its enlarged view |
1- Consolidation between 5639-5654
2- Most time trading between yesterday intraday support range(5653-5670) with intraday consolidation patterns.
3- Whole day acual trading between 5639-5670.
Conclusions from intra day chart analysis
Although all the Global markets were .55% to 2% down today and Nifty slipped also below yesterday intraday support range(5653-5670) but Nifty could not sustain below 5653 and recovered after getting support between 5639-5654.
As Nifty traded most time between above mentioned yesterday intraday support range(5653-5670) with intraday consolidation patterns and intraday supports at lower levels also today therefore high possibility of rally continuation after correction completion today.
Next trend confirmation range is 5639-5709.