

Nifty-Intra Day Chart (17-Sep-2012):-
Technical Patterns and Formations in today intraday charts
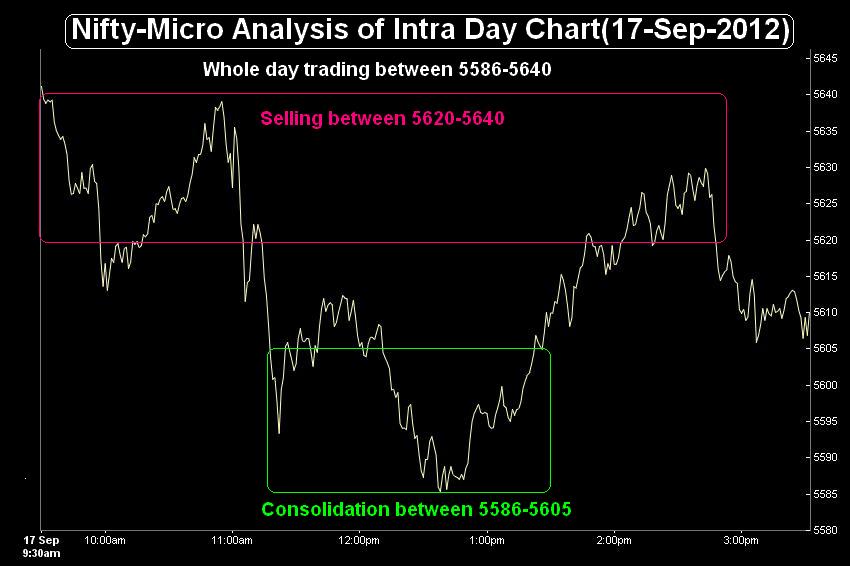
1- Selling between 5620-5640
2- Consolidation between 5586-5605
3- Whole day trading between
Whole day sideways intraday trading yesterday between 5586-5640 with higher levels selling patterns between 5620-5640 and minor consolidation between 5586-5605 . Follow up selling today and sustaining below 5586 will be very short term correction confirmation. As daily indicators are overbought also therefore mentioned correction possibility turned higher yesterday.
All trends are up and Indian markets are in the hands of Bulls but very short term correction possibility after strong gains in previous sessions. As both lower levels buying and higher levels intraday selling yesterday therefore Nifty will firstly trade and prepare for next decisive moves between yesterday intraday trading range(5586-5640),its break out will decide for further rally without correction or after correction.
 |
| Just click on chart for its enlarged view |
1- Selling between 5620-5640
2- Consolidation between 5586-5605
3- Whole day trading between
Conclusions from intra day chart analysis
Whole day sideways intraday trading yesterday between 5586-5640 with higher levels selling patterns between 5620-5640 and minor consolidation between 5586-5605 . Follow up selling today and sustaining below 5586 will be very short term correction confirmation. As daily indicators are overbought also therefore mentioned correction possibility turned higher yesterday.
All trends are up and Indian markets are in the hands of Bulls but very short term correction possibility after strong gains in previous sessions. As both lower levels buying and higher levels intraday selling yesterday therefore Nifty will firstly trade and prepare for next decisive moves between yesterday intraday trading range(5586-5640),its break out will decide for further rally without correction or after correction.