

Nifty-Intra Day Chart(23-Mar-2012):-
Technical Patterns and Formations in today intraday charts
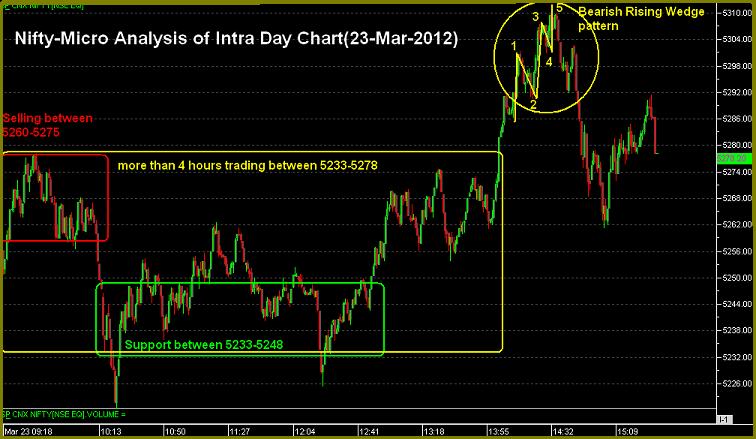
1- Selling between 5260-5275
2- Support between 5233-5248
3- Break out after more than 4 hours trading between 5233-5278
4- Bearish Rising Wedge pattern formations at the top.
3- Whole day trading between 5222-5312
Firstly more than 4 hours trading between 5233-5278 with mixed intraday patterns and then break out after European markets positive opening but failed to sustain at higher levels after Bearish Rising Wedge pattern formations and slipped.
Higher levels selling,lower levels support and next trend confirmations will be sustaining beyond today trading range(5222-5312) therefore it should be firstly watched in next week.
 |
| Just click on chart for its enlarged view |
1- Selling between 5260-5275
2- Support between 5233-5248
3- Break out after more than 4 hours trading between 5233-5278
4- Bearish Rising Wedge pattern formations at the top.
3- Whole day trading between 5222-5312
Conclusions from intra day chart analysis
Firstly more than 4 hours trading between 5233-5278 with mixed intraday patterns and then break out after European markets positive opening but failed to sustain at higher levels after Bearish Rising Wedge pattern formations and slipped.
Higher levels selling,lower levels support and next trend confirmations will be sustaining beyond today trading range(5222-5312) therefore it should be firstly watched in next week.