

Nifty-Intra Day Chart(22-Mar-2012):-
Technical Patterns and Formations in today intraday charts
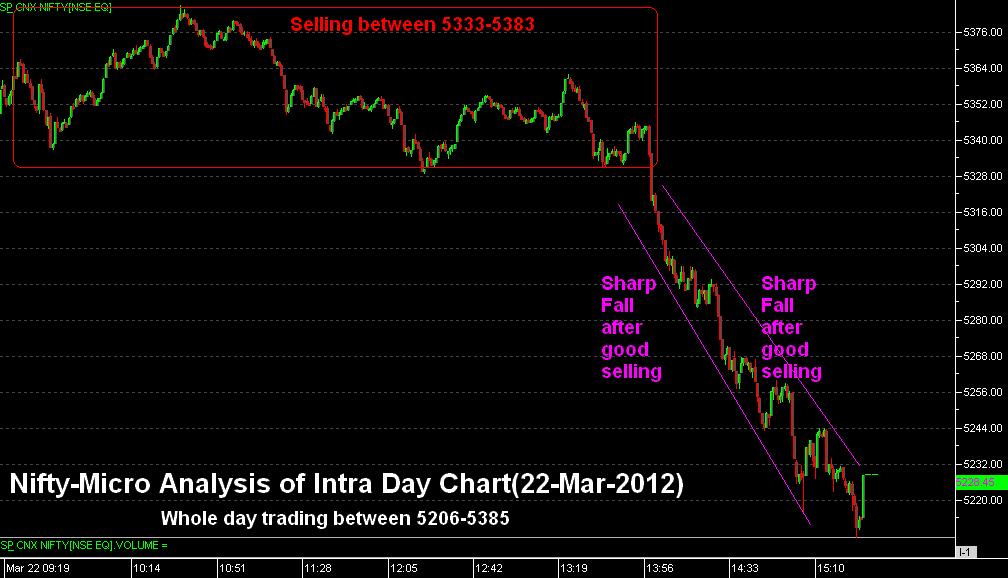
1- Selling between 5333-5383
2- Sharp Fall after good selling.
3- Whole day trading between 5206-5385
As soon as selling formation got confirmation then it was updated in Mid-session Outlook and only selling was repeated in all the intraday Outlooks as well as next targets were projected which achieved also.
Intermediate and Short Term Trends are down.Long Term trend is up but certainly at stake after good selling at higher levels and sustaining below following 2 levels will be confirmation Long Term Trend torning down:-
1- 200-Day EMA- 5203
2- 200-Day SMA- 5157
Sustaining below 5157 should be firstly watched tomorrow for Long Term Trend survival confirmations.
 |
| Just click on chart for its enlarged view |
1- Selling between 5333-5383
2- Sharp Fall after good selling.
3- Whole day trading between 5206-5385
Conclusions from intra day chart analysis
As soon as selling formation got confirmation then it was updated in Mid-session Outlook and only selling was repeated in all the intraday Outlooks as well as next targets were projected which achieved also.
Intermediate and Short Term Trends are down.Long Term trend is up but certainly at stake after good selling at higher levels and sustaining below following 2 levels will be confirmation Long Term Trend torning down:-
1- 200-Day EMA- 5203
2- 200-Day SMA- 5157
Sustaining below 5157 should be firstly watched tomorrow for Long Term Trend survival confirmations.