

Nifty-Intra Day Chart(18-Oct-2011):-
Technical Patterns and Formations in today intraday charts
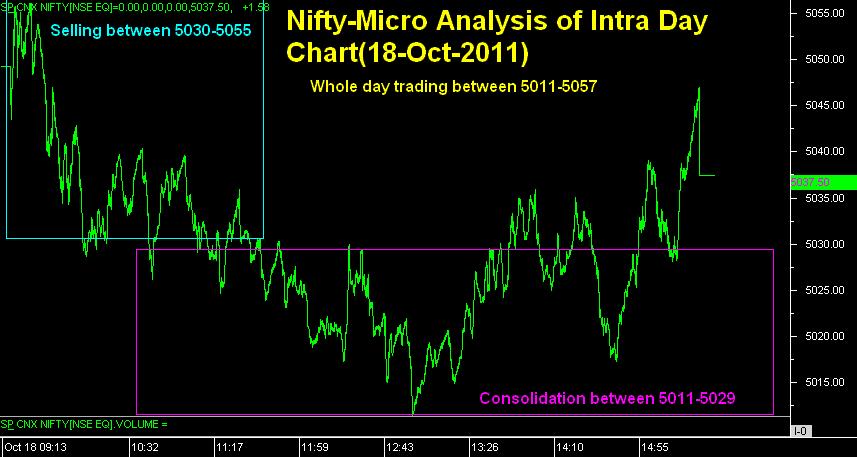
1- Selling between 5030-5057
2- Consolidation between 5011-5029
3- Whole day trading between 5011-5057
Conclusions
Gap down opening and whole day deep Red today trading was due to crashing Global markets cues therefore finally sustaining point of market will decide next trend. Although selling seen at higher levels but support also seen at lower levels today.
8 Days rally from the bottom of 49 sessions range lowest(4728) with 3 days range bound market with mixed intraday patterns within 5070-5155. As lower levels support today and and whole day intraday consolidation patterns also seen therefore sustaining above today high(5057) will be confirmation of 8 days corrction and its completion also today.
Today down moves were not the result of higher levels pure selling but depressing global cues therefore follow up buying in the coming sessions will mean up moves to test 8 days rally highest.
As whole day consolidation patterns today therefore positive market as well as up moves continuation expected tomorrow.
 |
| Just click on chart for its enlarged view |
1- Selling between 5030-5057
2- Consolidation between 5011-5029
3- Whole day trading between 5011-5057
Conclusions
Gap down opening and whole day deep Red today trading was due to crashing Global markets cues therefore finally sustaining point of market will decide next trend. Although selling seen at higher levels but support also seen at lower levels today.
8 Days rally from the bottom of 49 sessions range lowest(4728) with 3 days range bound market with mixed intraday patterns within 5070-5155. As lower levels support today and and whole day intraday consolidation patterns also seen therefore sustaining above today high(5057) will be confirmation of 8 days corrction and its completion also today.
Today down moves were not the result of higher levels pure selling but depressing global cues therefore follow up buying in the coming sessions will mean up moves to test 8 days rally highest.
As whole day consolidation patterns today therefore positive market as well as up moves continuation expected tomorrow.