


Weekly Analysis- 28-02-2011 to 04-03-2011
All trends are down and rally started from 5177 has been fused below 200-Day EMA after eruption of Libyan internal problems in last week. Multiple resistances are above 5600 but below it strong resistance range also below 5520 and Indian market requires complete consolidation process to cross 5520. Next crucial supoport near 5200 and slipping below it will mean ceratin testing os levels below 5000.
1- Multiple Resistances and only one Support Chart

(Just click on chart for its enlarged view)
2-10 Days Intraday Chart

(Just click on chart for its enlarged view)
Conclusion from above 2 charts analysis:-
Next support,resistances and next trend deciding ranges are as follows:-
1- 4460-5520(Strong resistance and Trend Decider)
2- 5350-5375(Testing possible in expectation of good budget)
3- 5235-5275(Support and Testing possible in Buget Voltality)
4- 5275-5460(Next trend deciding range)
5- Trading at Falling Channel Upper Line
3-Daily Indicators and Averages Analysis Chart
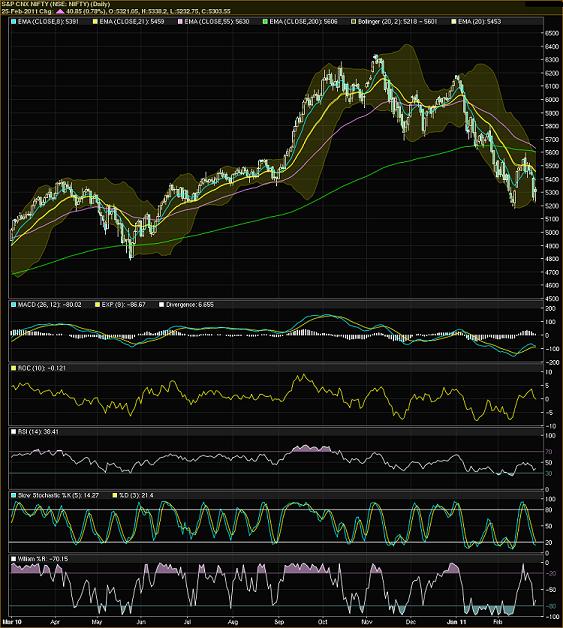
(Just click on chart for its enlarged view)
Conclusion from Daily Indicators and Averages Analysis:-
1-Averages- All the averages(8,21,55,200) are sliding and Nifty is trading below all of them. It is most bearish situation and indicating bounce back possibility only.
2-Bollinger Band- Lower band is rising and upper band is sliding.Nifty is trading near the lower band therefore confirming complete weakness and signalling relief rally possibility to recover from oversold situation.
3- MACD- MACD line is sliding,Average line is rising and both lines are in kissing position in negative zone therefore not indicating immediate next move. Downward intersection of average line will give down move confirmation and reversing to upside will give fresh upmove confirmation. No indication from this important indicator.
4-ROC- Reversing down and resting at zero line therefore not showing any immediate move indication.
5-RSI- Reversing down and resting at 50(equilibrium line) therefore not showing any immediate move indication.
6-Slow Stochastic- Reversing down and resting at 30(above oversold line) therefore not showing any immediate move indication.
7-William %R- Reversing down and resting at 20(above oversold line) therefore not showing any immediate move indication.
Conclusions (After Putting All Studies Together)
All the indicators are quiet and not showing any side moves. As indicators are near oversold zone therefore indicating short term bounce back possibility only. Market is moving down in falling channel and Nifty is trading at falling channel Upper Line for the last 2 days therefore not showing any side move confirmation.
4-Intraday chart of 25-02-2011 Chart:-

(Just click on chart for its enlarged view)
4460-5520 is strong resistance range and 5235-5275 is minor support range because intraday chart of 25-02-2011 is showing consolidation pattern and candle was Bullish Hammer. As strong resistances are at higher levels therefore Indian markets require complete consolidation to cross and sustain above 5520 and until it will not happen today till then Nifty will not cross 5520 despite whatsoever may be Budget proposals today.
Minor support within 5235-5275 and market require selling(distribution intraday patterns) before and during budget speech time and its happening will mean immediate sharp down moves below 5235 during or immediate after Budget speech.
It is very much clear that Indian markets are not prepared for immediate decisive moves after Budget. Any negative development will mean sharp down moves in Indian markets because "Bear is well settled to drag down Indian markets" and supports at lower levels(near 5200) are not strong. Positive development will mean firstly consolidation within 5350-5375 and then crossing and sustaining above 5375.
As per my view First today trading range will be 5285-5375 and forceful crossing or sustaining beyond will be strong indication of that side move. Voltality may be high and next trend confirmation range of post Budget big move is 5235-5520. Intraday chart formation before and during Budget hours will give first strong indication of post budget Indian markets and crossing of above levels will give confirmations.
Market is in Bearish mode and Bear is well settled to drag down Indian markets but Confirmation from break out of above menioned levels is must after last Friday consolidation pattern and Bullish Hammer candle. Whole week market will be toward the break out direction of 5275-5460.
Up moves will be slow because for every rise consolidation requires at every stage. As support at lower level is weak and below that next strong supports are at much lower levels therefore down moves may be in free fall mode also.