Whole day narrow range market with lower levels supports and consolidation patterns formations as well therefore rally continuation hopes are alive without deeper correction and next decisive moves confirmation will be valid break out of 6164-6221.

ॐ ह्रीं श्रीं लक्ष्मीभयो नमः॥

Mid-session Outlook(22-10-2013)
Although negative zone trading for the last more than 2 hours after slipping from higher levels today but intraday charts are showing consolidation indications therefore rally continuation hopes are still alive without deeper correction and next decisive moves confirmation will be valid break out of 6164-6221.
Technical Analysis and Market Outlook(22-10-2013)
Nifty-Intra Day Chart (21-Oct-2013):-
Technical Patterns and Formations in today intraday charts
1- Consolidation and supports between 6164-6190
2- Selling indications between 6196-6204
2- Down moves in Bullish Falling Channel.
3- Whole day actual trading between 6164-6218
As lower levels consolidations with supports and Bullish Falling Channel formations today therefore finally up moves are expected but selling indications also seen at higher levels therefore some more follow up consolidations is also must in the coming sessions.
 |
| Just click on chart for its enlarged view |
1- Consolidation and supports between 6164-6190
2- Selling indications between 6196-6204
2- Down moves in Bullish Falling Channel.
3- Whole day actual trading between 6164-6218
Conclusions from intra day chart analysis
As lower levels consolidations with supports and Bullish Falling Channel formations today therefore finally up moves are expected but selling indications also seen at higher levels therefore some more follow up consolidations is also must in the coming sessions.
Pre-closing Outlook(21-10-2013)
As sentiment was heated and Short term indicators were overbought therefore some intraday/very short term correction was expected and it was seen within sideways markets with consolidations patterns today. Finally up moves are expected after some more follow up consolidations in the coming sessions.
Mid-session Outlook(21-10-2013)
Sideways markets with consolidations patterns today therefore finally up moves are expected.
Minimum target of Nifty at 6724.60
Technical Analysis,Research & Weekly Outlook
Technical Analysis,Research & Weekly Outlook
(Oct 21 to Oct 25,2013)
Nifty-EOD Chart (18-Oct-2013):- |
| Just click on chart for its enlarged view |
1- Bottom formation at 5118.85 on 28-08-2013 and Wave-1 beginning
2- Wave-1(6142.50 on 19-09-2013) completion and 'ABC' correction continuation.
3- Wave-2(5700.95 on 21-10-2013) completion and Wave-3 continuation.
4- Wave-3 continuation and recent top formation at 6201.45 on 18-10-2013.
Conclusions from EOD chart analysis
Impulsive Wave-3 continuation and as per Elliot Wave theory "Wave-3 should not be shorter than both Wave-1 and Wave-5" therefore Wave 3 will move up more than Wave-1.
Wave-1 gained 6142.50-5118.85=1023.65
Wave-3 started from 5700.95 and and as per Elliot Wave theory it should gain minimum 1023.65 because it can not be shorter than Wave-1 therefore its minimum target is at:-
5700.95(Wave-3 started)+1023.65 Wave-1 gained=6724.60
As sentiment is heated and Short term indicators are overbought therefore some intraday/very short term corrections may be seen any day but as per Elliot Wave theory Nifty is well set for rally towards minimum target at 6724.60.
Nifty Spot-Weekly Levels & Trading Strategy(Oct 21 to Oct 25,2013)
Nifty Spot-Weekly Levels
R3 6417
R2 6309
R1 6249
Avg 6141
S1 6081
S2 5973
S3 5913
Nifty Spot-Weekly Trading Strategy
H6 6361 Trgt 2
H5 6321 Trgt 1
H4 6281 Long breakout
H3 6235 Go Short
H2 6219
H1 6204
L1 6173
L2 6158
L3 6142 Long
L4 6096 Short Breakout
L5 6056 Trgt 1
L6 6016 Trgt 2
R3 6417
R2 6309
R1 6249
Avg 6141
S1 6081
S2 5973
S3 5913
Nifty Spot-Weekly Trading Strategy
H6 6361 Trgt 2
H5 6321 Trgt 1
H4 6281 Long breakout
H3 6235 Go Short
H2 6219
H1 6204
L1 6173
L2 6158
L3 6142 Long
L4 6096 Short Breakout
L5 6056 Trgt 1
L6 6016 Trgt 2
Bank Nifty Spot-Weekly Levels & Trading Strategy(Oct 21 to Oct 25,2013)
Bank Nifty Spot-Weekly Levels
R3 11437
R2 11110
R1 10927
Avg 10600
S1 10417
S2 10090
S3 9907
Bank Nifty Spot-Weekly Trading Strategy
H6 11277 Trgt 2
H5 11150 Trgt 1
H4 11024 Long breakout
H3 10884 Go Short
H2 10837
H1 10790
L1 10697
L2 10650
L3 10603 Long
L4 10463 Short Breakout
L5 10337 Trgt 1
L6 10210 Trgt 2
R3 11437
R2 11110
R1 10927
Avg 10600
S1 10417
S2 10090
S3 9907
Bank Nifty Spot-Weekly Trading Strategy
H6 11277 Trgt 2
H5 11150 Trgt 1
H4 11024 Long breakout
H3 10884 Go Short
H2 10837
H1 10790
L1 10697
L2 10650
L3 10603 Long
L4 10463 Short Breakout
L5 10337 Trgt 1
L6 10210 Trgt 2
Mid-session Outlook(18-10-2013)
As Dow Jones recovered more than 100 points from lower levels and closed flat yesterday therefore sentiment improved and most Asian markets were in Green,resultant Indian markets are trading positive since opening as well as crossed all the resistances,now trading at the top of on going rally.
Wave-3 continuation after 4 sessions correction completion therefore following lines are being repeated which were told in Technical Analysis and Market Outlook(17-10-2013):-
Wave-3 continuation after 4 sessions correction completion therefore following lines are being repeated which were told in Technical Analysis and Market Outlook(17-10-2013):-
It should be kept in mind that once valid break out above 6156 will mean high possibility of new all time high formation and we are expecting it on 18-10-2013 or in next week.
Technical Analysis and Market Outlook(18-10-2013)
Nifty-Intra Day Chart (17-Oct-2013):-
Technical Patterns and Formations in today intraday charts
1- Selling between 6085-6110
3- Whole day actual trading between 6033-6110
Indian markets are technically poised for all time high formations because Wave-3 is continued for targets above all time highs but sentiment turned depressed and seling developed because CBI filed a FIR against Kumar Mangalam Birla and Former coal secretary P C Parakh which shaked the confidence of Industry and bureaucracy.
As Prime Minister Manmohan Singh was coal Minister at the time of scam therefore Mr Parakh commented that Prime Minister Manmohan Singh cannot escape responsibility and he should also be an accused as he is equally responsible in coal block allocations.
Sentiment dampened because PM name was involved logically and market slipped after good selling at higher levels. Previous 3 sessions trading between 6046-6156 with lower levels supports and higher levels selling within this range and closing at the lowest of this range today at 6045.85 after good selling between 6085-6110 today therefore until Nifty will not sustain above today highest(6110) till then next up moves will not be considered.
Next trend confirmation through valid break out of 6046-6156 was told in most of the previous Outlooks today and Nifty closed at 6045.85,once sustaining below it will mean deeper correction after the failure of Wave-3 and should be firstly watched tomorrow for confirmations.
 |
| Just click on chart for its enlarged view |
1- Selling between 6085-6110
3- Whole day actual trading between 6033-6110
Conclusions from intra day chart analysis
Indian markets are technically poised for all time high formations because Wave-3 is continued for targets above all time highs but sentiment turned depressed and seling developed because CBI filed a FIR against Kumar Mangalam Birla and Former coal secretary P C Parakh which shaked the confidence of Industry and bureaucracy.
As Prime Minister Manmohan Singh was coal Minister at the time of scam therefore Mr Parakh commented that Prime Minister Manmohan Singh cannot escape responsibility and he should also be an accused as he is equally responsible in coal block allocations.
Sentiment dampened because PM name was involved logically and market slipped after good selling at higher levels. Previous 3 sessions trading between 6046-6156 with lower levels supports and higher levels selling within this range and closing at the lowest of this range today at 6045.85 after good selling between 6085-6110 today therefore until Nifty will not sustain above today highest(6110) till then next up moves will not be considered.
Next trend confirmation through valid break out of 6046-6156 was told in most of the previous Outlooks today and Nifty closed at 6045.85,once sustaining below it will mean deeper correction after the failure of Wave-3 and should be firstly watched tomorrow for confirmations.
Nifty Spot-Levels & Trading Strategy for 18-10-2013
Nifty Spot-Levels
R3 6170
R2 6140
R1 6092
Avg 6062
S1 6014
S2 5984
S3 5936
Nifty Spot-Trading Strategy
H6 6123 Trgt 2
H5 6105 Trgt 1
H4 6087 Long breakout
H3 6066 Go Short
H2 6059
H1 6052
L1 6037
L2 6030
L3 6023 Long
L4 6002 Short Breakout
L5 5984 Trgt 1
L6 5966 Trgt 2
R3 6170
R2 6140
R1 6092
Avg 6062
S1 6014
S2 5984
S3 5936
Nifty Spot-Trading Strategy
H6 6123 Trgt 2
H5 6105 Trgt 1
H4 6087 Long breakout
H3 6066 Go Short
H2 6059
H1 6052
L1 6037
L2 6030
L3 6023 Long
L4 6002 Short Breakout
L5 5984 Trgt 1
L6 5966 Trgt 2
Nifty(Oct Fut)-Levels & Trading Strategy for 18-10-2013
Nifty(Oct Fut)-Levels
R3 6201
R2 6170
R1 6120
Avg 6089
S1 6039
S2 6008
S3 5958
Nifty(Oct Fut)-Trading Strategy
H6 6152 Trgt 2
H5 6133 Trgt 1
H4 6115 Long breakout
H3 6093 Go Short
H2 6085
H1 6078
L1 6063
L2 6056
L3 6048 Long
L4 6026 Short Breakout
L5 6008 Trgt 1
L6 5989 Trgt 2
R3 6201
R2 6170
R1 6120
Avg 6089
S1 6039
S2 6008
S3 5958
Nifty(Oct Fut)-Trading Strategy
H6 6152 Trgt 2
H5 6133 Trgt 1
H4 6115 Long breakout
H3 6093 Go Short
H2 6085
H1 6078
L1 6063
L2 6056
L3 6048 Long
L4 6026 Short Breakout
L5 6008 Trgt 1
L6 5989 Trgt 2
Bank Nifty(Oct Fut)-Levels & Trading Strategy for 18-10-2013
Bank Nifty(Oct Fut)-Levels
R3 10627
R2 10545
R1 10459
Avg 10377
S1 10291
S2 10209
S3 10123
Bank Nifty(Oct Fut)-Trading Strategy
H6 10543 Trgt 2
H5 10504 Trgt 1
H4 10466 Long breakout
H3 10420 Go Short
H2 10404
H1 10389
L1 10358
L2 10343
L3 10327 Long
L4 10281 Short Breakout
L5 10243 Trgt 1
L6 10204 Trgt 2
R3 10627
R2 10545
R1 10459
Avg 10377
S1 10291
S2 10209
S3 10123
Bank Nifty(Oct Fut)-Trading Strategy
H6 10543 Trgt 2
H5 10504 Trgt 1
H4 10466 Long breakout
H3 10420 Go Short
H2 10404
H1 10389
L1 10358
L2 10343
L3 10327 Long
L4 10281 Short Breakout
L5 10243 Trgt 1
L6 10204 Trgt 2
Mid-session Outlook-2 (17-10-2013)
Nifty is hovering around 6046 for the last half hour after higher levels selling,sustaining beyond it should be firstly watched for deeper correction confirmations.
Mid-session Outlook(17-10-2013)
Indian markets are technically poised for all time high formations because Wave-3 is continued for targets above all time highs but view is cautious today and valid break out of 6046-6156 should be firstly watched because sentiment is being dampened due to following recent developments:-
1- CBI filed a FIR against Kumar Mangalam Birla and Former coal secretary P C Parakh over alleged irregularities in the allocation of a coal block in Orissa, sending shock waves among industrialists and bureaucrats across the country.
2- Mr Parakh commented that Prime Minister Manmohan Singh cannot escape responsibility in the controversial allocations and PM should also be an accused as he is equally responsible in coal block allocations.
Post-open Outlook(17-10-2013)
Flat market despite positive news from USA because Indian markets have to prepare for next trend between 6046-6156,firstly valid break out of this range should be watched for next big trend confirmations.
Let market prepare for decisive moves then will be updated according to intraday charts formations.
Let market prepare for decisive moves then will be updated according to intraday charts formations.
Technical Analysis and Market Outlook(17-10-2013)
Nifty-Intra Day Chart (14-Oct-2013):-
Technical Patterns and Formations in today intraday charts
1- Consolidation between 6057-6090
2- Whole day actual trading between 6057-6156
Wave-3 is on but correction was expected after intraday selling in previous sessions and it was seen also on 14-10-2013 with sharp slipping from higher levels. As good consolidation at lower levels therefore until Nifty will not sustain below the lowest of the day(6057) till then next down moves will not be considered and correction completion will also be considered because some times Bull markets complete its correction within sideways market also.
Previous 3 sessions trading between 6046-6156 with lower levels supports and selling within this range also therefore expected that Nifty will firstly trade within this range and prepare for next trend and Valid break out of this range should be firstly watched in the coming sessions for deeper correction below 6046 or strong rally above 6156.
 |
| Just click on chart for its enlarged view |
1- Consolidation between 6057-6090
2- Whole day actual trading between 6057-6156
Conclusions from intra day chart analysis
Wave-3 is on but correction was expected after intraday selling in previous sessions and it was seen also on 14-10-2013 with sharp slipping from higher levels. As good consolidation at lower levels therefore until Nifty will not sustain below the lowest of the day(6057) till then next down moves will not be considered and correction completion will also be considered because some times Bull markets complete its correction within sideways market also.
Previous 3 sessions trading between 6046-6156 with lower levels supports and selling within this range also therefore expected that Nifty will firstly trade within this range and prepare for next trend and Valid break out of this range should be firstly watched in the coming sessions for deeper correction below 6046 or strong rally above 6156.
It should be kept in mind that once valid break out above 6156 will mean high possibility of new all time high formation and we are expecting it on 18-10-2013 or in next week.
Nifty Spot-Levels & Trading Strategy for 17-10-2013
Nifty Spot-Levels
R3 6244
R2 6200
R1 6144
Avg 6100
S1 6044
S2 6000
S3 5944
Nifty Spot-Trading Strategy
H6 6189 Trgt 2
H5 6166 Trgt 1
H4 6144 Long breakout
H3 6116 Go Short
H2 6107
H1 6098
L1 6079
L2 6070
L3 6061 Long
L4 6034 Short Breakout
L5 6011 Trgt 1
L6 5988 Trgt 2
R3 6244
R2 6200
R1 6144
Avg 6100
S1 6044
S2 6000
S3 5944
Nifty Spot-Trading Strategy
H6 6189 Trgt 2
H5 6166 Trgt 1
H4 6144 Long breakout
H3 6116 Go Short
H2 6107
H1 6098
L1 6079
L2 6070
L3 6061 Long
L4 6034 Short Breakout
L5 6011 Trgt 1
L6 5988 Trgt 2
Nifty(Oct Fut)-Levels & Trading Strategy for 17-10-2013
Nifty(Oct Fut)-Levels
R3 6292
R2 6242
R1 6176
Avg 6126
S1 6060
S2 6010
S3 5944
Nifty(Oct Fut)-Trading Strategy
H6 6226 Trgt 2
H5 6200 Trgt 1
H4 6173 Long breakout
H3 6141 Go Short
H2 6131
H1 6120
L1 6099
L2 6088
L3 6078 Long
L4 6046 Short Breakout
L5 6019 Trgt 1
L6 5993 Trgt 2
R3 6292
R2 6242
R1 6176
Avg 6126
S1 6060
S2 6010
S3 5944
Nifty(Oct Fut)-Trading Strategy
H6 6226 Trgt 2
H5 6200 Trgt 1
H4 6173 Long breakout
H3 6141 Go Short
H2 6131
H1 6120
L1 6099
L2 6088
L3 6078 Long
L4 6046 Short Breakout
L5 6019 Trgt 1
L6 5993 Trgt 2
Bank Nifty(Oct Fut)-Levels & Trading Strategy for 17-10-2013
Bank Nifty(Oct Fut)-Levels
R3 11091
R2 10940
R1 10683
Avg 10532
S1 10275
S2 10124
S3 9867
Bank Nifty(Oct Fut)-Trading Strategy
H6 10836 Trgt 2
H5 10744 Trgt 1
H4 10651 Long breakout
H3 10539 Go Short
H2 10501
H1 10464
L1 10389
L2 10352
L3 10314 Long
L4 10202 Short Breakout
L5 10109 Trgt 1
L6 10017 Trgt 2
R3 11091
R2 10940
R1 10683
Avg 10532
S1 10275
S2 10124
S3 9867
Bank Nifty(Oct Fut)-Trading Strategy
H6 10836 Trgt 2
H5 10744 Trgt 1
H4 10651 Long breakout
H3 10539 Go Short
H2 10501
H1 10464
L1 10389
L2 10352
L3 10314 Long
L4 10202 Short Breakout
L5 10109 Trgt 1
L6 10017 Trgt 2
Live Proofs of Indian Stock Markets 100% Accurate Predictions
 Who predicted Indian markets with such accuracy in whole India as was done in this Blog:-
Nifty is now trading 51 points down at 6061 but when Nifty was traing at 6155 and was 43 points up then following line was told today at 09:46 AM in previous Outlook:-
finally down moves will be seen in the coming sessions.
Although Nifty closed near the highest of the day yesterday but following lines were told yesterday in Technical Analysis and Market Outlook:-
Nifty will not sustain above today highest(6123) and will slip below today lowest(6086) despite closing near higher levels of the day today.
Following line was told yesterday in Post-closing Report:-
Although now trading near the highs of today but intraday charts are showing selling patterns.
Following line was told yesterday in Mid-session Outlook
Although most time positive zone trading since opening today but intraday charts are showing selling patterns.
Not only yesterday and today but 'Archive' with 'more than 6500 posts' at the bottom of Blog' is live proof of "many hundreds" such accurate and miraculous predictions in last 4 years. Anyone can verify this facts anytime from the Blog 'Archive'.
Post-open Outlook(15-10-2013)
As US markets strongly recovered from lower levels and closed with sufficient gains yesterday therefore sentiment turned strong and all the Asian markets are trading in Green today morning,resultant gap up opening in Indian markets. As Indian markets are overbought and previous sessions intraday charts are showing selling patterns formations as well as up moves are US shut down solution expectation reaction therefore expected that finally down moves will be seen in the coming sessions.
Technical Analysis and Market Outlook(15-10-2013)
Nifty-Intra Day Chart (14-Oct-2013):-
Technical Patterns and Formations in today intraday charts
1- Selling between 6114-6123
2- Up moves in Bearish Rising Channel
3- Whole day actual trading between 6086-6123
Although most time positive zone trading since opening today but Up moves in Bearish Rising Channel with higher levels selling also therefore expected that Nifty will not sustain above today highest(6123) and will slip below today lowest(6086) despite closing near higher levels of the day today.
 |
| Just click on chart for its enlarged view |
1- Selling between 6114-6123
2- Up moves in Bearish Rising Channel
3- Whole day actual trading between 6086-6123
Conclusions from intra day chart analysis
Although most time positive zone trading since opening today but Up moves in Bearish Rising Channel with higher levels selling also therefore expected that Nifty will not sustain above today highest(6123) and will slip below today lowest(6086) despite closing near higher levels of the day today.
Nifty Spot-Levels & Trading Strategy for 15-10-2013
Nifty Spot-Levels
R3 6172
R2 6148
R1 6130
Avg 6106
S1 6088
S2 6064
S3 6046
Nifty Spot-Trading Strategy
H6 6124 Trgt 2
H5 6114 Trgt 1
H4 6104 Long breakout
H3 6093 Go Short
H2 6089
H1 6085
L1 6078
L2 6074
L3 6070 Long
L4 6059 Short Breakout
L5 6050 Trgt 1
L6 6040 Trgt 2
R3 6172
R2 6148
R1 6130
Avg 6106
S1 6088
S2 6064
S3 6046
Nifty Spot-Trading Strategy
H6 6124 Trgt 2
H5 6114 Trgt 1
H4 6104 Long breakout
H3 6093 Go Short
H2 6089
H1 6085
L1 6078
L2 6074
L3 6070 Long
L4 6059 Short Breakout
L5 6050 Trgt 1
L6 6040 Trgt 2
Nifty(Oct Fut)-Levels & Trading Strategy for 15-10-2013
Nifty(Oct Fut)-Levels
R3 6213
R2 6183
R1 6163
Avg 6133
S1 6113
S2 6083
S3 6063
Nifty(Oct Fut)-Trading Strategy
H6 6193 Trgt 2
H5 6181 Trgt 1
H4 6170 Long breakout
H3 6156 Go Short
H2 6152
H1 6147
L1 6138
L2 6133
L3 6129 Long
L4 6126 Short Breakout
L5 6115 Trgt 1
L6 6092 Trgt 2
R3 6213
R2 6183
R1 6163
Avg 6133
S1 6113
S2 6083
S3 6063
Nifty(Oct Fut)-Trading Strategy
H6 6193 Trgt 2
H5 6181 Trgt 1
H4 6170 Long breakout
H3 6156 Go Short
H2 6152
H1 6147
L1 6138
L2 6133
L3 6129 Long
L4 6126 Short Breakout
L5 6115 Trgt 1
L6 6092 Trgt 2
Bank Nifty(Oct Fut)-Levels & Trading Strategy for 15-10-2013
Bank Nifty(Oct Fut)-Levels
R3 10966
R2 10867
R1 10789
Avg 10690
S1 10612
S2 10513
S3 10435
Bank Nifty(Oct Fut)-Trading Strategy
H6 10889 Trgt 2
H5 10841 Trgt 1
H4 10808 Long breakout
H3 10759 Go Short
H2 10743
H1 10727
L1 10694
L2 10678
L3 10662 Long
L4 10613 Short Breakout
L5 10573 Trgt 1
L6 10532 Trgt 2
R3 10966
R2 10867
R1 10789
Avg 10690
S1 10612
S2 10513
S3 10435
Bank Nifty(Oct Fut)-Trading Strategy
H6 10889 Trgt 2
H5 10841 Trgt 1
H4 10808 Long breakout
H3 10759 Go Short
H2 10743
H1 10727
L1 10694
L2 10678
L3 10662 Long
L4 10613 Short Breakout
L5 10573 Trgt 1
L6 10532 Trgt 2
Post-closing Report(14-10-2013)
Although now trading near the highs of today but intraday charts are showing selling patterns.
Mid-session Outlook(14-10-2013)
Although most time positive zone trading since opening today but intraday charts are showing selling patterns.
.jpg)
Technical Analysis,Research & Weekly Outlook(Oct 14 to Oct 18,2013
Nifty-EOD Chart (11-Oct-2013):-
Technical Patterns and Formations in EOD charts
1- All time high formation at 6357.10 on 08-01-2008
2- 1st Lower top formation at 6338.50 on 05-11-2010
3- 2nd Lower top formation at 6229.45 on 20-05-2013
4- 3rd Lower top formation at 6142.50 on 19-09-2013
Conclusions from EOD chart analysis
As 3 times lower top formations since all time high formation in Jan 2008 therefore above mentioned resistances psychological at higher higher levels.
Nifty-EOD Chart (11-Oct-2013):-
Technical Patterns and Formations in EOD charts
Hanging Man Bearish Candle formation on 11-10-2013
Conclusions from EOD chart analysis
Hanging Man candle means sell off after the market opens during an uptrend. However, by the end of the trading day, the market closes near the top the day. This signifies the potential for further follow up selling in the coming sessions. Trend reversal can be confirmation be by a black candlestick or a large down gap on the next trading day accompanied by a lower close.
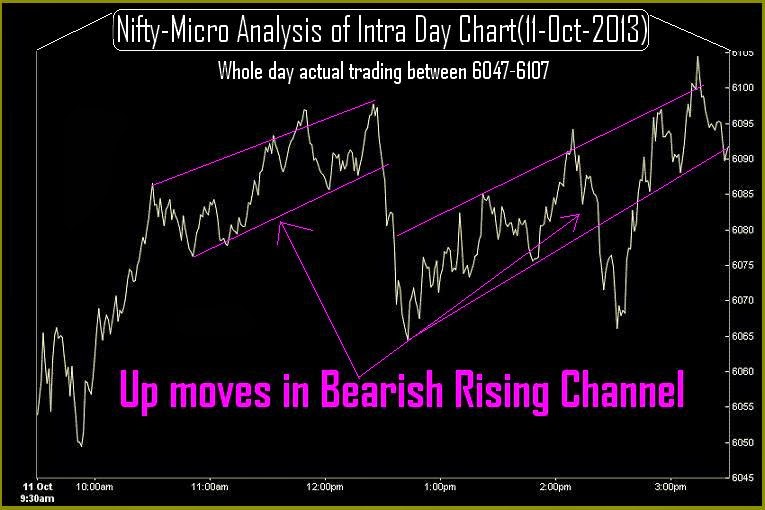
Nifty-Intra Day Chart (11-Oct-2013):-
Technical Patterns and Formations in today intraday charts
1- Up moves in Bearish Rising Channel.
3- Whole day actual trading between 6047-6107
Conclusions from intra day chart analysis
As up moves in Bearish Rising Channel therefore therefore emrgence of down moves possibility.
 |
| Technical Patterns and Formations in EOD charts |
1- All time high formation at 6357.10 on 08-01-2008
2- 1st Lower top formation at 6338.50 on 05-11-2010
3- 2nd Lower top formation at 6229.45 on 20-05-2013
4- 3rd Lower top formation at 6142.50 on 19-09-2013
Conclusions from EOD chart analysis
As 3 times lower top formations since all time high formation in Jan 2008 therefore above mentioned resistances psychological at higher higher levels.
Nifty-EOD Chart (11-Oct-2013):-
 |
| Just click on chart for its enlarged view |
Hanging Man Bearish Candle formation on 11-10-2013
Conclusions from EOD chart analysis
Hanging Man candle means sell off after the market opens during an uptrend. However, by the end of the trading day, the market closes near the top the day. This signifies the potential for further follow up selling in the coming sessions. Trend reversal can be confirmation be by a black candlestick or a large down gap on the next trading day accompanied by a lower close.
Nifty-Intra Day Chart (11-Oct-2013):-
 |
| Just click on chart for its enlarged view |
1- Up moves in Bearish Rising Channel.
3- Whole day actual trading between 6047-6107
Conclusions from intra day chart analysis
As up moves in Bearish Rising Channel therefore therefore emrgence of down moves possibility.
Conclusions (After Putting All Indicators Together)
All trends are up but selling patterns formations on intraday charts and Bearish candle formation also last Friday. As such down moves signals seen just below Falling trend lines from all time high therefore down moves in the beginning of coming week and finally sustaining beyond 5702-6142 will decide next Long Term Trend in the coming week.
Nifty Spot-Levels & Trading Strategy for 14-10-2013
Nifty Spot-Levels
R3 6181
R2 6144
R1 6120
Avg 6083
S1 6059
S2 6022
S3 5998
Nifty Spot-Trading Strategy
H6 6157 Trgt 2
H5 6143 Trgt 1
H4 6129 Long breakout
H3 6112 Go Short
H2 6107
H1 6101
L1 6090
L2 6084
L3 6079 Long
L4 6062 Short Breakout
L5 6048 Trgt 1
L6 6034 Trgt 2
R3 6181
R2 6144
R1 6120
Avg 6083
S1 6059
S2 6022
S3 5998
Nifty Spot-Trading Strategy
H6 6157 Trgt 2
H5 6143 Trgt 1
H4 6129 Long breakout
H3 6112 Go Short
H2 6107
H1 6101
L1 6090
L2 6084
L3 6079 Long
L4 6062 Short Breakout
L5 6048 Trgt 1
L6 6034 Trgt 2
Nifty(Oct Fut)-Levels & Trading Strategy for 14-10-2013
Nifty(Oct Fut)-Levels
R3 6229
R2 6186
R1 6158
Avg 6115
S1 6087
S2 6044
S3 6016
Nifty(Oct Fut)-Trading Strategy
H6 6201 Trgt 2
H5 6185 Trgt 1
H4 6169 Long breakout
H3 6149 Go Short
H2 6143
H1 6136
L1 6123
L2 6116
L3 6110 Long
L4 6090 Short Breakout
L5 6074 Trgt 1
L6 6058 Trgt 2
R3 6229
R2 6186
R1 6158
Avg 6115
S1 6087
S2 6044
S3 6016
Nifty(Oct Fut)-Trading Strategy
H6 6201 Trgt 2
H5 6185 Trgt 1
H4 6169 Long breakout
H3 6149 Go Short
H2 6143
H1 6136
L1 6123
L2 6116
L3 6110 Long
L4 6090 Short Breakout
L5 6074 Trgt 1
L6 6058 Trgt 2
Bank Nifty(Oct Fut)-Levels & Trading Strategy for 14-10-2013
Bank Nifty(Oct Fut)-Levels
R3 11154
R2 10931
R1 10803
Avg 10580
S1 10452
S2 10229
S3 10101
Bank Nifty(Oct Fut)-Trading Strategy
H6 11036 Trgt 2
H5 10952 Trgt 1
H4 10868 Long breakout
H3 10771 Go Short
H2 10739
H1 10707
L1 10642
L2 10610
L3 10578 Long
L4 10481 Short Breakout
L5 10397 Trgt 1
L6 10313 Trgt 2
R3 11154
R2 10931
R1 10803
Avg 10580
S1 10452
S2 10229
S3 10101
Bank Nifty(Oct Fut)-Trading Strategy
H6 11036 Trgt 2
H5 10952 Trgt 1
H4 10868 Long breakout
H3 10771 Go Short
H2 10739
H1 10707
L1 10642
L2 10610
L3 10578 Long
L4 10481 Short Breakout
L5 10397 Trgt 1
L6 10313 Trgt 2
Nifty Spot-Weekly Levels & Trading Strategy(Oct 14 to Oct 18,2013)
Nifty Spot-Weekly Levels
R3 6474
R2 6290
R1 6193
Avg 6009
S1 5912
S2 5728
S3 5631
Nifty Spot-Weekly Trading Strategy
H6 6390 Trgt 2
H5 6320 Trgt 1
H4 6250 Long breakout
H3 6173 Go Short
H2 6147
H1 6121
L1 6070
L2 6044
L3 6018 Long
L4 5941 Short Breakout
L5 5871 Trgt 1
L6 5801 Trgt 2
R3 6474
R2 6290
R1 6193
Avg 6009
S1 5912
S2 5728
S3 5631
Nifty Spot-Weekly Trading Strategy
H6 6390 Trgt 2
H5 6320 Trgt 1
H4 6250 Long breakout
H3 6173 Go Short
H2 6147
H1 6121
L1 6070
L2 6044
L3 6018 Long
L4 5941 Short Breakout
L5 5871 Trgt 1
L6 5801 Trgt 2
Bank Nifty Spot-Weekly Levels & Trading Strategy(Oct 14 to Oct 18,2013)
Bank Nifty Spot-Weekly Levels
R3 11660
R2 11154
R1 10888
Avg 10382
S1 10116
S2 9610
S3 9344
Bank Nifty Spot-Weekly Trading Strategy
H6 11452 Trgt 2
H5 11249 Trgt 1
H4 11046 Long breakout
H3 10834 Go Short
H2 10763
H1 10692
L1 10551
L2 10480
L3 10409 Long
L4 10197 Short Breakout
L5 9994 Trgt 1
L6 9791 Trgt 2
R3 11660
R2 11154
R1 10888
Avg 10382
S1 10116
S2 9610
S3 9344
Bank Nifty Spot-Weekly Trading Strategy
H6 11452 Trgt 2
H5 11249 Trgt 1
H4 11046 Long breakout
H3 10834 Go Short
H2 10763
H1 10692
L1 10551
L2 10480
L3 10409 Long
L4 10197 Short Breakout
L5 9994 Trgt 1
L6 9791 Trgt 2
Pre-closing Outlook(11-10-2013)
Although now trading near the highs of the day but today intraday charts are showing selling patterns formations and expected that correction will begin after completion of distribution within next 1/2 sessions.
Post-open Outlook(11-10-2013)
Global markets rally today after US markets blasting moves yesterday and Indian markets participation through strong gap up opening. As news based led market today therefore sustaining above yesterday highest(6031) is must for next rally because good selling seen yesterday.
Technical Analysis and Market Outlook(11-10-2013)
Nifty-Intra Day Chart (10-Oct-2013):-
Technical Patterns and Formations in today intraday charts
1- All up moves from lower levels in Bearish Rising Channel
2- Higher levels selling patterns formations.
3- Whole day actual trading between 5979-6031
Whole day sideways trading with Bearish Rising Channel formations and higher levels selling patterns formations also therefore emergence of distribution(selling) process. Although closing at higher levels of the day today but down moves possibilities turned alive after completion of distribution.
 |
| Just click on chart for its enlarged view |
1- All up moves from lower levels in Bearish Rising Channel
2- Higher levels selling patterns formations.
3- Whole day actual trading between 5979-6031
Conclusions from intra day chart analysis
Whole day sideways trading with Bearish Rising Channel formations and higher levels selling patterns formations also therefore emergence of distribution(selling) process. Although closing at higher levels of the day today but down moves possibilities turned alive after completion of distribution.
Nifty Spot-Levels & Trading Strategy for 11-10-2013
Nifty Spot-Levels
R3 6096
R2 6064
R1 6042
Avg 6010
S1 5988
S2 5956
S3 5934
Nifty Spot-Trading Strategy
H6 6074 Trgt 2
H5 6062 Trgt 1
H4 6049 Long breakout
H3 6034 Go Short
H2 6029
H1 6024
L1 6015
L2 6010
L3 6005 Long
L4 5990 Short Breakout
L5 5977 Trgt 1
L6 5965 Trgt 2
R3 6096
R2 6064
R1 6042
Avg 6010
S1 5988
S2 5956
S3 5934
Nifty Spot-Trading Strategy
H6 6074 Trgt 2
H5 6062 Trgt 1
H4 6049 Long breakout
H3 6034 Go Short
H2 6029
H1 6024
L1 6015
L2 6010
L3 6005 Long
L4 5990 Short Breakout
L5 5977 Trgt 1
L6 5965 Trgt 2
Nifty(Oct Fut)-Levels & Trading Strategy for 11-10-2013
Nifty(Oct Fut)-Levels
R3 6154
R2 6113
R1 6086
Avg 6045
S1 6018
S2 5977
S3 5950
Nifty(Oct Fut)-Trading Strategy
H6 6127 Trgt 2
H5 6112 Trgt 1
H4 6096 Long breakout
H3 6077 Go Short
H2 6071
H1 6065
L1 6052
L2 6046
L3 6040 Long
L4 6021 Short Breakout
L5 6006 Trgt 1
L6 5990 Trgt 2
R3 6154
R2 6113
R1 6086
Avg 6045
S1 6018
S2 5977
S3 5950
Nifty(Oct Fut)-Trading Strategy
H6 6127 Trgt 2
H5 6112 Trgt 1
H4 6096 Long breakout
H3 6077 Go Short
H2 6071
H1 6065
L1 6052
L2 6046
L3 6040 Long
L4 6021 Short Breakout
L5 6006 Trgt 1
L6 5990 Trgt 2
Bank Nifty(Oct Fut)-Levels & Trading Strategy for 11-10-2013
Bank Nifty(Oct Fut)-Levels
R3 10636
R2 10537
R1 10450
Avg 10351
S1 10264
S2 10165
S3 10078
Bank Nifty(Oct Fut)-Trading Strategy
H6 10551 Trgt 2
H5 10508 Trgt 1
H4 10465 Long breakout
H3 10414 Go Short
H2 10397
H1 10380
L1 10345
L2 10328
L3 10311 Long
L4 10260 Short Breakout
L5 10217 Trgt 1
L6 10175. Trgt 2
R3 10636
R2 10537
R1 10450
Avg 10351
S1 10264
S2 10165
S3 10078
Bank Nifty(Oct Fut)-Trading Strategy
H6 10551 Trgt 2
H5 10508 Trgt 1
H4 10465 Long breakout
H3 10414 Go Short
H2 10397
H1 10380
L1 10345
L2 10328
L3 10311 Long
L4 10260 Short Breakout
L5 10217 Trgt 1
L6 10175. Trgt 2
Mid-session Outlook-2 (10-10-2013)
Whole day sideways trading with higher levels selling patterns formations.
Mid-session Outlook(10-10-2013)
Following lines were told in previous Outlook yesterday:-
1- we are expecting some intraday correction tomorrow
2- next moves confirmation through sustaining beyond 5981
Correction seen after higher levels selling between 6005-5019 and some recovery also seen after getting supports at 5979.80.
As both selling and support in first 3 hours today therefore firstly valid break out of 8980-6019 should be watched for next immediate moves confirmations.
Technical Analysis and Market Outlook(10-10-2013)
Nifty-Intra Day Chart (09-Oct-2013):-
Technical Patterns and Formations in today intraday charts
1- Whole day up moves in Bearish Rising Channel.
2- Whole day actual trading between 5878-6015
Although gap down opening but closing at the highest level of the day with good 1.33% gains and closing above 20 sessions most time trading range(5737-5981) therefore emergence of next big up trend first indication but sustaining above 5981 is must for valid break out.
As Whole day up moves were in Bearish Rising Channel today therefore strong intraday up moves of today may be short covering rally and may fizzle out also.
 |
| Just click on chart for its enlarged view |
1- Whole day up moves in Bearish Rising Channel.
2- Whole day actual trading between 5878-6015
Conclusions from intra day chart analysis
Although gap down opening but closing at the highest level of the day with good 1.33% gains and closing above 20 sessions most time trading range(5737-5981) therefore emergence of next big up trend first indication but sustaining above 5981 is must for valid break out.
As Whole day up moves were in Bearish Rising Channel today therefore strong intraday up moves of today may be short covering rally and may fizzle out also.
Although whole sentiment is Bullish today but we are expecting some intraday correction tomorrow and telling for next moves confirmation through sustaining beyond 5981.
Nifty Spot-Levels & Trading Strategy for 10-10-2013
Nifty Spot-Levels
R3 6193
R2 6104
R1 6055
Avg 5966
S1 5917
S2 5828
S3 5779
Nifty Spot-Trading Strategy
H6 6148 Trgt 2
H5 6115 Trgt 1
H4 6082 Long breakout
H3 6044 Go Short
H2 6032
H1 6019
L1 5994
L2 5981
L3 5969 Long
L4 5931 Short Breakout
L5 5898 Trgt 1
L6 5865 Trgt 2
R3 6193
R2 6104
R1 6055
Avg 5966
S1 5917
S2 5828
S3 5779
Nifty Spot-Trading Strategy
H6 6148 Trgt 2
H5 6115 Trgt 1
H4 6082 Long breakout
H3 6044 Go Short
H2 6032
H1 6019
L1 5994
L2 5981
L3 5969 Long
L4 5931 Short Breakout
L5 5898 Trgt 1
L6 5865 Trgt 2
Nifty(Oct Fut)-Levels & Trading Strategy for 10-10-2013
Nifty(Oct Fut)-Levels
R3 6253
R2 6155
R1 6101
Avg 6003
S1 5949
S2 5851
S3 5797
Nifty(Oct Fut)-Trading Strategy
H6 6203 Trgt 2
H5 6167 Trgt 1
H4 6131 Long breakout
H3 6089 Go Short
H2 6075
H1 6061
L1 6034
L2 6020
L3 6006 Long
L4 5964 Short Breakout
L5 5928 Trgt 1
L6 5892 Trgt 2
R3 6253
R2 6155
R1 6101
Avg 6003
S1 5949
S2 5851
S3 5797
Nifty(Oct Fut)-Trading Strategy
H6 6203 Trgt 2
H5 6167 Trgt 1
H4 6131 Long breakout
H3 6089 Go Short
H2 6075
H1 6061
L1 6034
L2 6020
L3 6006 Long
L4 5964 Short Breakout
L5 5928 Trgt 1
L6 5892 Trgt 2
Bank Nifty(Oct Fut)-Levels & Trading Strategy for 10-10-2013
Bank Nifty(Oct Fut)-Levels
R3 10967
R2 10694
R1 10547
Avg 10274
S1 10127
S2 9854
S3 9707
Bank Nifty(Oct Fut)-Trading Strategy
H6 10836 Trgt 2
H5 10733 Trgt 1
H4 10631 Long breakout
H3 10515 Go Short
H2 10477
H1 10438
L1 10361
L2 10323
L3 10284 Long
L4 10169 Short Breakout
L5 10066 Trgt 1
L6 9963 Trgt 2
R3 10967
R2 10694
R1 10547
Avg 10274
S1 10127
S2 9854
S3 9707
Bank Nifty(Oct Fut)-Trading Strategy
H6 10836 Trgt 2
H5 10733 Trgt 1
H4 10631 Long breakout
H3 10515 Go Short
H2 10477
H1 10438
L1 10361
L2 10323
L3 10284 Long
L4 10169 Short Breakout
L5 10066 Trgt 1
L6 9963 Trgt 2
Mid-session Outlook(09-10-2013)
Although Indian markets closed at the lowest of the day yesterday but down moves were in Bullish Falling channel with lower levels supports also therefore following line was told in both previous Outlooks yesterday:-
Huge gap down opening after most depressing global cues today but strong recovery from lower levels and now Nifty is trading 27 points up after 51 points down trading.
Only news based intraday volatility without too much technical positions formations will be understood at present. Some selling and buying seen in both previous sessions between 5826-5981 therefore sustaining beyond this range should be watched for next Long Term Trend first strong indication.
"rally continuation hopes are still alive"
Huge gap down opening after most depressing global cues today but strong recovery from lower levels and now Nifty is trading 27 points up after 51 points down trading.
Only news based intraday volatility without too much technical positions formations will be understood at present. Some selling and buying seen in both previous sessions between 5826-5981 therefore sustaining beyond this range should be watched for next Long Term Trend first strong indication.
Technical Analysis and Market Outlook(09-10-2013)
Nifty-Intra Day Chart (08-Oct-2013):-
Technical Patterns and Formations in today intraday charts
1- Selling between 5955-5981
2- Down moves in Bullish Falling channel
3- Multiple supports at lower levels.
4- Whole day actual trading between 5913-5981
Although strong gap up opening after MSF rate cut news but not sustaining at higher levels because selling between 5955-5981. As today down moves in Bullish Falling channel and supports at lower levels also therefore rally continuation hopes are still alive because lower levels good supports seen yesterday.
News based 2 volatile sessions with lower levels supports yesterday and closing near higher levels amid most depressing Global markets but on the contrary higher levels selling today and closing near lower levels after positive news of MSF rates cut. Last 2 sessions moves are clear from last 2 sessions following chart:-
Nifty-Intra Day Chart (Oct 07 & Oct 08,2013):-
News based 2 volatile sessions with lower levels supports yesterday and higher levels selling today therefore Nifty will trade within 2 sessions range(5826-5981) as well as prepare for valid break out 2 sessions range.
20 Sessions sideways market between 5701-6142 and both Long Term Trend decider 200 Day SMA and 200 Day EMA are lying within this range,it is confirm that sustaining beyond this range will give very big moves in Indian markets. As most time trading between 5737-5981 therefore its valid break out will be next big trend first indication.
 |
| Just click on chart for its enlarged view |
1- Selling between 5955-5981
2- Down moves in Bullish Falling channel
3- Multiple supports at lower levels.
4- Whole day actual trading between 5913-5981
Conclusions from intra day chart analysis
Although strong gap up opening after MSF rate cut news but not sustaining at higher levels because selling between 5955-5981. As today down moves in Bullish Falling channel and supports at lower levels also therefore rally continuation hopes are still alive because lower levels good supports seen yesterday.
News based 2 volatile sessions with lower levels supports yesterday and closing near higher levels amid most depressing Global markets but on the contrary higher levels selling today and closing near lower levels after positive news of MSF rates cut. Last 2 sessions moves are clear from last 2 sessions following chart:-
Nifty-Intra Day Chart (Oct 07 & Oct 08,2013):-
 |
| Just click on chart for its enlarged view |
20 Sessions sideways market between 5701-6142 and both Long Term Trend decider 200 Day SMA and 200 Day EMA are lying within this range,it is confirm that sustaining beyond this range will give very big moves in Indian markets. As most time trading between 5737-5981 therefore its valid break out will be next big trend first indication.
Subscribe to:
Posts (Atom)