

ॐ ह्रीं श्रीं लक्ष्मीभयो नमः॥

FII & DII trading activity in Capital Market Segment on 16-May-2013
| ||||||||||||||||
| ||||||||||||||||
Indian Stock Markets Closing Reports(16-May-2013
Main features of today trading are as follows
Ratios
Index Options Put Call Ratio: 1.05
Total Options Put Call Ratio: 0.98
Nifty P/E Ratio(16-May-2013): 18.24
Advances & Declines
BSE Advances : 1,199
BSE Declines : 1,277
NSE Advances : 687
NSE Declines : 718
Nifty Open Interest Changed Today
Nifty- 5900 CE(May)- -238,600(-8.96%)
Nifty- 5900 PE(May)- -291,400(-3.68%)
Nifty- 6000 CE(May)- -548,400(-13.81%)
Nifty- 6000 PE(May)- 583,100(7.95%)
Nifty- 6100 CE(May)- -247,700(-4.04%)
Nifty- 6100 PE(May)- 491,250 (10.31%)
Nifty- 6200 CE(May)- 274,750(4.00%)
Nifty- 6200 PE(May)- 793,650(28.22%)
Nifty- 6300 CE(May)- 220,600(4.44%)
Nifty- 6300 PE(May)- 223,950(49.77%)
Closing
Sensex- closed at 20,247.33(34.37 Points & 0.17%)
Nifty- closed at 6,169.90(23.15 Points & 0.38%)
CNX Midcap - closed at 8,142.00(48.35 Points & 0.60%)
CNX Smallcap- closed at 3,358.35(12.35 Points & 0.37%)
Nifty Spot-Levels & Trading Strategy for 17-05-2013
Nifty Spot-Levels
R3 6253
R2 6220
R1 6194
Avg 6161
S1 6135
S2 6102
S3 6076
Nifty Spot-Trading Strategy
H6 6228 Trgt 2
H5 6214 Trgt 1
H4 6201 Long breakout
H3 6185 Go Short
H2 6179
H1 6174
L1 6163
L2 6158
L3 6152 Long
L4 6136 Short Breakout
L5 6123 Trgt 1
L6 6109 Trgt 2
R3 6253
R2 6220
R1 6194
Avg 6161
S1 6135
S2 6102
S3 6076
Nifty Spot-Trading Strategy
H6 6228 Trgt 2
H5 6214 Trgt 1
H4 6201 Long breakout
H3 6185 Go Short
H2 6179
H1 6174
L1 6163
L2 6158
L3 6152 Long
L4 6136 Short Breakout
L5 6123 Trgt 1
L6 6109 Trgt 2
Nifty(May Fut)-Levels & Trading Strategy for 17-05-2013
Nifty(May Fut)-Levels
R3 6258
R2 6228
R1 6203
Avg 6173
S1 6148
S2 6118
S3 6093
Nifty(May Fut)-Trading Strategy
H6 6233 Trgt 2
H5 6220 Trgt 1
H4 6208 Long breakout
H3 6193 Go Short
H2 6188
H1 6183
L1 6172
L2 6167
L3 6162 Long
L4 6147 Short Breakout
L5 6135 Trgt 1
L6 6122 Trgt 2
R3 6258
R2 6228
R1 6203
Avg 6173
S1 6148
S2 6118
S3 6093
Nifty(May Fut)-Trading Strategy
H6 6233 Trgt 2
H5 6220 Trgt 1
H4 6208 Long breakout
H3 6193 Go Short
H2 6188
H1 6183
L1 6172
L2 6167
L3 6162 Long
L4 6147 Short Breakout
L5 6135 Trgt 1
L6 6122 Trgt 2
Bank Nifty(May Fut)-Levels & Trading Strategy for 17-05-2013
Bank Nifty(May Fut)-Levels
R3 13531
R2 13390
R1 13282
Avg 13141
S1 13033
S2 12892
S3 12784
Bank Nifty(May Fut)-Trading Strategy
H6 13427 Trgt 2
H5 13369 Trgt 1
H4 13311 Long breakout
H3 13243 Go Short
H2 13220
H1 13197
L1 13152
L2 13129
L3 13106 Long
L4 13038 Short Breakout
L5 12980 Trgt 1
L6 12922 Trgt 2
R3 13531
R2 13390
R1 13282
Avg 13141
S1 13033
S2 12892
S3 12784
Bank Nifty(May Fut)-Trading Strategy
H6 13427 Trgt 2
H5 13369 Trgt 1
H4 13311 Long breakout
H3 13243 Go Short
H2 13220
H1 13197
L1 13152
L2 13129
L3 13106 Long
L4 13038 Short Breakout
L5 12980 Trgt 1
L6 12922 Trgt 2
Pre-Closing Outlook-2(16-05-2013)
Whole day narrow range trading in Green with higher levels selling and lower levels supports today therefore sustaining beyond today actual trading range(6156-6186) will be next very short term term trend confirmation but down moves possibilities are more because good selling seen at higher levels today.
Pre-Closing Outlook(16-05-2013)
As higher levels selling and lower levels supports seen today therefore sustaining beyond today actual trading range(6156-6186) and follow up moves tomorrow will decide next very short term term trend.
Mid-session Outlook(16-05-2013)
Although Green zone trading since opening today but intraday charts are showing selling patterns formations at higher levels.
Technical Analysis and Market Outlook(16-05-2013)
Nifty-Intra Day Chart (15-May-2013):-
Technical Patterns and Formations in today intraday charts
1- Whole day strong rally.
2- Higher levels narrow range trading between 6105-6125 with consolidation indications.
3- Whole day actual trading between 6031-6152
-
All trends are up and Whole day strong rally yesterday after RBI governor ststement that he has taken note of falling inflation, reinforcing bets about future rate cuts. Running Bullish rally is very much on and such types of rally runs fast despite overbought negative divergence showing indicators as well as correct after higher levels consolidations therefore until complete selling patterns will not form on EOD charts till then any deeper correction will not be considered.
As strong up moves yesterday therefore some intraday corrections may be seen today but higher levels narrow range trading between 6105-6125 with consolidation indications yesterday therefore firstly sustaining beyond this range should be watched for the confirmations of:-
1- Rally continuation without any correction above 6125 or
2- Very short term correction below 6105 and until clear intraday selling patterns will not develop till then only such correction will be considered. .
 |
| Just click on chart for its enlarged view |
1- Whole day strong rally.
2- Higher levels narrow range trading between 6105-6125 with consolidation indications.
3- Whole day actual trading between 6031-6152
-
Conclusions from intra day chart analysis
All trends are up and Whole day strong rally yesterday after RBI governor ststement that he has taken note of falling inflation, reinforcing bets about future rate cuts. Running Bullish rally is very much on and such types of rally runs fast despite overbought negative divergence showing indicators as well as correct after higher levels consolidations therefore until complete selling patterns will not form on EOD charts till then any deeper correction will not be considered.
As strong up moves yesterday therefore some intraday corrections may be seen today but higher levels narrow range trading between 6105-6125 with consolidation indications yesterday therefore firstly sustaining beyond this range should be watched for the confirmations of:-
1- Rally continuation without any correction above 6125 or
2- Very short term correction below 6105 and until clear intraday selling patterns will not develop till then only such correction will be considered. .
FII & DII trading activity in Capital Market Segment on 15-May-2013
| ||||||||||||||||
| ||||||||||||||||

Nifty Spot-Levels & Trading Strategy for 16-05-2013
Nifty Spot-Levels
R3 6335
R2 6246
R1 6196
Avg 6107
S1 6057
S2 5968
S3 5918
Nifty Spot-Trading Strategy
H6 6287 Trgt 2
H5 6255 Trgt 1
H4 6222 Long breakout
H3 6184 Go Short
H2 6171
H1 6158
L1 6133
L2 6120
L3 6107 Long
L4 6069 Short Breakout
L5 6036 Trgt 1
L6 6004 Trgt 2
R3 6335
R2 6246
R1 6196
Avg 6107
S1 6057
S2 5968
S3 5918
Nifty Spot-Trading Strategy
H6 6287 Trgt 2
H5 6255 Trgt 1
H4 6222 Long breakout
H3 6184 Go Short
H2 6171
H1 6158
L1 6133
L2 6120
L3 6107 Long
L4 6069 Short Breakout
L5 6036 Trgt 1
L6 6004 Trgt 2
Nifty(May Fut)-Levels & Trading Strategy for 16-05-2013
Nifty(May Fut)-Levels
R3 6352
R2 6260
R1 6210
Avg 6118
S1 6068
S2 5976
S3 5926
Nifty(May Fut)-Trading Strategy
H6 6306 Trgt 2
H5 6272 Trgt 1
H4 6239 Long breakout
H3 6200 Go Short
H2 6187
H1 6174
L1 6147
L2 6134
L3 6121 Long
L4 6082 Short Breakout
L5 6049 Trgt 1
L6 6015 Trgt 2
R3 6352
R2 6260
R1 6210
Avg 6118
S1 6068
S2 5976
S3 5926
Nifty(May Fut)-Trading Strategy
H6 6306 Trgt 2
H5 6272 Trgt 1
H4 6239 Long breakout
H3 6200 Go Short
H2 6187
H1 6174
L1 6147
L2 6134
L3 6121 Long
L4 6082 Short Breakout
L5 6049 Trgt 1
L6 6015 Trgt 2
Bank Nifty(May Fut)-Levels & Trading Strategy for 16-05-2013
Bank Nifty(May Fut)-Levels
R3 13689
R2 13377
R1 13209
Avg 12897
S1 12729
S2 12417
S3 12249
Bank Nifty(May Fut)-Trading Strategy
H6 13539 Trgt 2
H5 13422 Trgt 1
H4 13306 Long breakout
H3 13174 Go Short
H2 13130
H1 13086
L1 12998
L2 12954
L3 12910 Long
L4 12778 Short Breakout
L5 12661 Trgt 1
L6 12544 Trgt 2
R3 13689
R2 13377
R1 13209
Avg 12897
S1 12729
S2 12417
S3 12249
Bank Nifty(May Fut)-Trading Strategy
H6 13539 Trgt 2
H5 13422 Trgt 1
H4 13306 Long breakout
H3 13174 Go Short
H2 13130
H1 13086
L1 12998
L2 12954
L3 12910 Long
L4 12778 Short Breakout
L5 12661 Trgt 1
L6 12544 Trgt 2
Mid-session Outlook(15-05-2013)
As sharp Correction on 11-05-2013 after previous week 5 sessions selling and intraday charts of yesterday also showed selling formations therefore correction was expected but RBI governor sparked rate cut hopes and rally seen in Bond and Stock markets. Although today rally is without previous sessions consolidations and on the other hand selling also in previous sessions but Bull markets consolidate at higher levels after such positive news flow therefore strong rally is being seen today.
Impulsive Wave-5 is on and correction will be possible only after complete selling patterns formations,let it happen then then correction will be considered otherwise rally will remain continued.
Impulsive Wave-5 is on and correction will be possible only after complete selling patterns formations,let it happen then then correction will be considered otherwise rally will remain continued.
Sensex, bonds rally as RBI governor sparks rate cut hopes
(Reuters) - Bonds and Sensex rallied on Wednesday, sending key indicators to their highest in several years, after the hawkish RBI governor said he had taken note of falling inflation, reinforcing bets about future rate cuts.
Just click following links for detailed news:-
http://in.reuters.com/article/2013/05/15/sensex-nifty-banks-rbi-inflation-icici-t-idINDEE94E02W20130515
http://economictimes.indiatimes.com/markets/bonds/bonds-extend-rally-rbi-governor-sparks-rate-cut-hopes/articleshow/20061846.cms
Just click following links for detailed news:-
http://in.reuters.com/article/2013/05/15/sensex-nifty-banks-rbi-inflation-icici-t-idINDEE94E02W20130515
http://economictimes.indiatimes.com/markets/bonds/bonds-extend-rally-rbi-governor-sparks-rate-cut-hopes/articleshow/20061846.cms
Post-open Outlook-2(15-05-2013)
Although no positive reaction yesterday on good news of more than 1% reduction of WPI Inflation but strong rally immediately after opening today and cleared immediate resistance range(6055-6095) as well as new high of the rally formation today. As market did not showed positive reaction on such good news yesterday therefore correction continuation was expected but strong rally today and rally continuation will be considered after sustaining confirmation above immediate resistance range(6055-6095)
Post-open Outlook(15-05-2013)
Good up moves today on the back of strong Global cues and immediate resistances are also between 6055-6095. Correction continuation is still expected but sustaining beyond mentioned resistance range should also be firstly watched for next trend confirmations.
Technical Analysis and Market Outlook(15-05-2013)
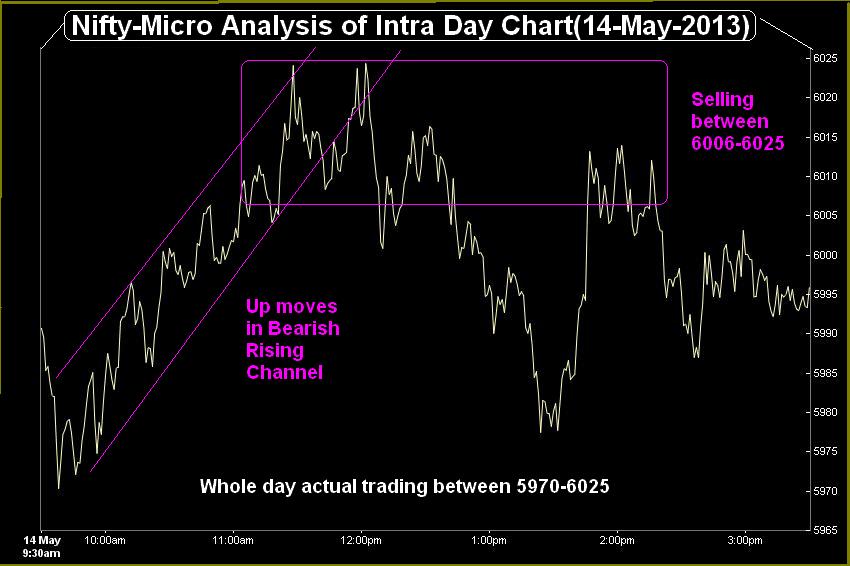
Nifty-Intra Day Chart (14-May-2013):-
Technical Patterns and Formations in today intraday charts
1- Up moves in Bearish Rising Channel.
1- Selling between 6006-6025
3- Whole day actual trading between 5970-6025
Firstly more than first 2 hours up moves in Bearish Rising channel and it was broken down despite good news of more than 1% reduction of WPI Inflation as well as higher levels selling formations therefore suggesting down moves and correction continuation.
Pre-open Outlook(15-05-2013)
Most of the Asian markets are in Green after strong closing of US and European markets yesterday therefore sentiment is good today morning and some up moves will be seen after positive opening today. Some recovery can not be ruled out today on the back of strong global cues but higher levels selling yesterday therefore expected that finally Nifty will not sustain above 6025 and will slip in the coming sessions.
For next immediate trend confirmations sustaining beyond yesterday trading range should also be watched.
 |
| Just click on chart for its enlarged view |
1- Up moves in Bearish Rising Channel.
1- Selling between 6006-6025
3- Whole day actual trading between 5970-6025
Conclusions from intra day chart analysis
Firstly more than first 2 hours up moves in Bearish Rising channel and it was broken down despite good news of more than 1% reduction of WPI Inflation as well as higher levels selling formations therefore suggesting down moves and correction continuation.
Pre-open Outlook(15-05-2013)
Most of the Asian markets are in Green after strong closing of US and European markets yesterday therefore sentiment is good today morning and some up moves will be seen after positive opening today. Some recovery can not be ruled out today on the back of strong global cues but higher levels selling yesterday therefore expected that finally Nifty will not sustain above 6025 and will slip in the coming sessions.
For next immediate trend confirmations sustaining beyond yesterday trading range should also be watched.

FII & DII trading activity in Capital Market Segment on 14-May-2013
| ||||||||||||||||
| ||||||||||||||||
Nifty Spot-Levels & Trading Strategy for 15-05-2013
Nifty Spot-Levels
R3 6080
R2 6053
R1 6024
Avg 5997
S1 5968
S2 5941
S3 5912
Nifty Spot-Trading Strategy
H6 6051 Trgt 2
H5 6038 Trgt 1
H4 6025 Long breakout
H3 6010 Go Short
H2 6005
H1 6000
L1 5989
L2 5984
L3 5979 Long
L4 5964 Short Breakout
L5 5951 Trgt 1
L6 5938 Trgt 2
R3 6080
R2 6053
R1 6024
Avg 5997
S1 5968
S2 5941
S3 5912
Nifty Spot-Trading Strategy
H6 6051 Trgt 2
H5 6038 Trgt 1
H4 6025 Long breakout
H3 6010 Go Short
H2 6005
H1 6000
L1 5989
L2 5984
L3 5979 Long
L4 5964 Short Breakout
L5 5951 Trgt 1
L6 5938 Trgt 2
Nifty(May Fut)-Levels & Trading Strategy for 15-05-2013
Nifty(May Fut)-Levels
R3 6095
R2 6067
R1 6036
Avg 6008
S1 5977
S2 5949
S3 5918
Nifty(May Fut)-Trading Strategy
H6 6065 Trgt 2
H5 6051 Trgt 1
H4 6038 Long breakout
H3 6022 Go Short
H2 6016
H1 6011
L1 6000
L2 5995
L3 5989 Long
L4 5973 Short Breakout
L5 5960 Trgt 1
L6 5946 Trgt 2
R3 6095
R2 6067
R1 6036
Avg 6008
S1 5977
S2 5949
S3 5918
Nifty(May Fut)-Trading Strategy
H6 6065 Trgt 2
H5 6051 Trgt 1
H4 6038 Long breakout
H3 6022 Go Short
H2 6016
H1 6011
L1 6000
L2 5995
L3 5989 Long
L4 5973 Short Breakout
L5 5960 Trgt 1
L6 5946 Trgt 2
Bank Nifty(May Fut)-Levels & Trading Strategy for 15-05-2013
Bank Nifty(May Fut)-Levels
R3 12855
R2 12765
R1 12648
Avg 12558
S1 12441
S2 12351
S3 12234
Bank Nifty(May Fut)-Trading Strategy
H6 12739 Trgt 2
H5 12691 Trgt 1
H4 12644 Long breakout
H3 12587 Go Short
H2 12568
H1 12549
L1 12512
L2 12493
L3 12474 Long
L4 12417 Short Breakout
L5 12370 Trgt 1
L6 12322 Trgt 2
R3 12855
R2 12765
R1 12648
Avg 12558
S1 12441
S2 12351
S3 12234
Bank Nifty(May Fut)-Trading Strategy
H6 12739 Trgt 2
H5 12691 Trgt 1
H4 12644 Long breakout
H3 12587 Go Short
H2 12568
H1 12549
L1 12512
L2 12493
L3 12474 Long
L4 12417 Short Breakout
L5 12370 Trgt 1
L6 12322 Trgt 2
Mid-session Outlook-2 (14-05-2013)
As intraday selling patterns formation today therefore correction continuation is expected in the coming sessions.
Post-open Outlook(14-05-2013)
As reduced WPI inflation is expected today and sentiment is depressed after yesterday fall therefore some recovery from lower levels today for the improvement of market mood and some more up moves also can not be ruled out. As strong resistances are between 6055-6095 therefore next sustained up moves above 6095 will be seen only after complete consolidations,let it happen then rally will be considered otherwise correction is continued and more down moves in the coming sessions can not be ruled out after facing resistances at higher levels.
Live Proofs of our 100% Accurate Predictions
Following lines were told at 06:51 AM on 11-05-2013 which proved 100% Accurate in both previous Bullish and Bearish sessions:-
Green zone trading will be seen in today short special session and new top above 6111.80 is also possible but it should be kept in mind that Short Term Correction is very much due and may begin any day.
Our above prediction proved 100% accurate in following manner:-
1- On 11-05-2013:- "Nifty closed 12 points up with new top formations at 6114.55"
2- On 13-05-2013:- "Nifty closed 126 points down"
Just click following topic link and verify above fact on yours own:-
Corrective Wave-A of impulsive Wave-5 confirmation yesterday
Technical Analysis and Market Outlook(14-05-2013)
Nifty-Intra Day Chart (May 07 to May 13,2013):-
 |
| Just click on chart for its enlarged view |
1- Good selling in previous week.
2- 6 sessions lowest formation in a single day down moves on 13-05-2013.
Conclusions from 6 Sessions intra day chart analysis
Although 6 sessions lowest formation in a single day down moves on 13-05-2013 but intraday showed selling formations in previous week therefore we clearly told for following lines for correction in previous sessions:-
1- On 10-05-2013 in Correcion on cards:-"Short Term correction is very much possible"
2- On 11-05-2013 in Technical Analysis and Market Outlook(11-05-2013):-
i- "correction is very much due because selling patterns seen in previous sessions also"
ii- "emergence of selling patterns in intraday charts therefore correction is very much due now"
iii- " it should be kept in mind that Short Term Correction is very much due and may begin any day"
As was clearly told for correction again and again same happened yesterday,Nifty closed below the lowest of previous 5 sessions and formed almost 'Engulfing Bearish Candle' which is confirmation of Short Term correction. As correction was due after previous 5 sessions selling therefore seen yesterday and such complete consolidation is also required for next upward wave above 6114.
Long and Intermediate Term Trends are up and Short Term Trend turned down as well as confirmation of Corrective Wave-A of impulsive Wave-5 yesterday. Now 'ABC' correction is on and following Fibonacci Retracement Levels levels should be watched for correction completion confirmations:-
27.0%- 5942
38.2%- 5870
50.0%- 5795
61.8%- 5720
70.7%- 5663
76.4%- 5627
Correction confirmation and it will take its own time. Let down moves stop and consolidation begin as well as correction complete then will be updated in the same manner as being done in for the last 3 years.

FII & DII trading activity in Capital Market Segment on 13-May-2013
| ||||||||||||||||
| ||||||||||||||||
Indian Stock Markets Closing Reports(13-May-2013)
Main features of today trading are as follows
Ratios
Index Options Put Call Ratio: 1.05
Total Options Put Call Ratio: 1.01
Nifty P/E Ratio(13-May-2013): 17.74
Advances & Declines
BSE Advances : 809
BSE Declines : 1,540
NSE Advances : 383
NSE Declines : 1,033
Nifty Open Interest Changed Today
Nifty- 5800 CE(May)- 31,100(1.47%)
Nifty- 5800 PE(May)- -477,600(-5.29%)
Nifty- 5900 CE(May)- 12,750(0.42%)
Nifty- 5900 PE(May)- -614,750(-8.53%)
Nifty- 6000 CE(May)- 1,383,500(30.15%)
Nifty- 6000 PE(May)- -475,550(-7.44%)
Nifty- 6100 CE(May)- 553,100(10.09%)
Nifty- 6100 PE(May)- -472,900(-14.33%)
Nifty- 6200 CE(May)- -164,450(-2.05%)
Nifty- 6200 PE(May)- -135,400(-13.34%)
Closing
Sensex- closed at 19,691.67(-430.65 Points & -2.14%)
Nifty- closed at 5,980.45(-126.80 Points & -2.08%)
CNX Midcap - closed at 7,884.95(-145.95 Points & -1.82%)
CNX Smallcap- closed at 3,306.80(-51.80 Points & -1.54%)
Nifty Spot-Levels & Trading Strategy for 14-05-2013
Nifty Spot-Levels
R3 6197
R2 6150
R1 6065
Avg 6018
S1 5933
S2 5886
S3 5801
Nifty Spot-Trading Strategy
H6 6112 Trgt 2
H5 6082 Trgt 1
H4 6052 Long breakout
H3 6016 Go Short
H2 6004
H1 5992
L1 5967
L2 5955
L3 5943 Long
L4 5907 Short Breakout
L5 5877 Trgt 1
L6 5847 Trgt 2
R3 6197
R2 6150
R1 6065
Avg 6018
S1 5933
S2 5886
S3 5801
Nifty Spot-Trading Strategy
H6 6112 Trgt 2
H5 6082 Trgt 1
H4 6052 Long breakout
H3 6016 Go Short
H2 6004
H1 5992
L1 5967
L2 5955
L3 5943 Long
L4 5907 Short Breakout
L5 5877 Trgt 1
L6 5847 Trgt 2
Nifty(May Fut)-Levels & Trading Strategy for 14-05-2013
Nifty(May Fut)-Levels
R3 6213
R2 6166
R1 6080
Avg 6033
S1 5947
S2 5900
S3 5814
Nifty(May Fut)-Trading Strategy
H6 6127 Trgt 2
H5 6097 Trgt 1
H4 6067 Long breakout
H3 6030 Go Short
H2 6018
H1 6006
L1 5981
L2 5969
L3 5957 Long
L4 5920 Short Breakout
L5 5890 Trgt 1
L6 5860 Trgt 2
R3 6213
R2 6166
R1 6080
Avg 6033
S1 5947
S2 5900
S3 5814
Nifty(May Fut)-Trading Strategy
H6 6127 Trgt 2
H5 6097 Trgt 1
H4 6067 Long breakout
H3 6030 Go Short
H2 6018
H1 6006
L1 5981
L2 5969
L3 5957 Long
L4 5920 Short Breakout
L5 5890 Trgt 1
L6 5860 Trgt 2
Bank Nifty(May Fut)-Levels & Trading Strategy for 14-05-2013
Bank Nifty(May Fut)-Levels
R3 13076
R2 12955
R1 12743
Avg 12622
S1 12410
S2 12289
S3 12077
Bank Nifty(May Fut)-Trading Strategy
H6 12864 Trgt 2
H5 12789 Trgt 1
H4 12714 Long breakout
H3 12622 Go Short
H2 12592
H1 12561
L1 12500
L2 12469
L3 12439 Long
L4 12347 Short Breakout
L5 12272 Trgt 1
L6 12197 Trgt 2
R3 13076
R2 12955
R1 12743
Avg 12622
S1 12410
S2 12289
S3 12077
Bank Nifty(May Fut)-Trading Strategy
H6 12864 Trgt 2
H5 12789 Trgt 1
H4 12714 Long breakout
H3 12622 Go Short
H2 12592
H1 12561
L1 12500
L2 12469
L3 12439 Long
L4 12347 Short Breakout
L5 12272 Trgt 1
L6 12197 Trgt 2
Mid-session Outlook(13-05-2013)
As sufficient reduction in CPI inflation(MoM) as well as lower levels intraday supports today therefore some up moves after weak opening. All trends are up but Short Term Correction is also very much due because indicators are showing negative divergence in overbought zone. Although rally top formation on 11-05-2013 but intraday selling patterns formations were also seen in previous week therefore minor correction is being seen today.
Trading is expected between 6025-6114 with minimum sideways correction possibility.
Live Proofs of our 100% Accurate Predictions of next target above 6111.80
Although new top formations at 6114.55 today but we predicted well before its happening on:-
1- 21-04-2013
2- 31-03-2013
3- Today at 06:51 AM
Just click following links and verify this fact on yours own:
Following topic was posted on 21-04-2013:-
Wave 5 confirmations for new top of rally above 6111.80
Following topic was posted on 31-03-2013:-
Wave 5 formation towards next target above 6111.80
Following line was told today at 06:51:00 AM in Technical Analysis and Market Outlook(11-05-2013):-
Green zone trading will be seen in today short special session and new top above 6111.80 is also possible
Technical Analysis and Market Outlook(11-05-2013)
Nifty-Intra Day Chart (10-May-2013):-
Technical Patterns and Formations in today intraday charts
1- Selling between 6060-6075
2- Selling between 6047-6057
3- Mixed Patterns between 6079-6105
4- Whole day actual trading between 6047-6105
Although good selling at lower levels but Indian markets moved up because European markets moved up sharply after sudden sharp rise in US Futures as well as positive news of IIP numbers improvement. Closing near the top of the day after almost last 3 hours trading at intraday higher levels with mixed Pattern formations.
As sentiment is strong after more than 600 points rally in 20 sessions therefore closing near higher levels despite lower levels selling yesterday but sustaining with fresh consolidation at higher levels is must for next decisive rally continuation otherwise correction is very much due because selling patterns seen in previous sessions also.
All trends are up but indicators have started to show negative divergence in Overbought zone as well as emergence of selling patterns in intraday charts therefore correction is very much due now. As markets moves rolling on slowly in last legs of rally therefore without force up moves are being seen in previous sessions.
As sentiment is good today after US and European markets positive closing yesterday therefore Green zone trading will be seen in today short special session and new top above 6111.80 is also possible but it should be kept in mind that Short Term Correction is very much due and may begin any day.
 |
| Just click on chart for its enlarged view |
1- Selling between 6060-6075
2- Selling between 6047-6057
3- Mixed Patterns between 6079-6105
4- Whole day actual trading between 6047-6105
Conclusions from intra day chart analysis
Although good selling at lower levels but Indian markets moved up because European markets moved up sharply after sudden sharp rise in US Futures as well as positive news of IIP numbers improvement. Closing near the top of the day after almost last 3 hours trading at intraday higher levels with mixed Pattern formations.
As sentiment is strong after more than 600 points rally in 20 sessions therefore closing near higher levels despite lower levels selling yesterday but sustaining with fresh consolidation at higher levels is must for next decisive rally continuation otherwise correction is very much due because selling patterns seen in previous sessions also.
All trends are up but indicators have started to show negative divergence in Overbought zone as well as emergence of selling patterns in intraday charts therefore correction is very much due now. As markets moves rolling on slowly in last legs of rally therefore without force up moves are being seen in previous sessions.
As sentiment is good today after US and European markets positive closing yesterday therefore Green zone trading will be seen in today short special session and new top above 6111.80 is also possible but it should be kept in mind that Short Term Correction is very much due and may begin any day.

FII & DII trading activity in Capital Market Segment on 10-May-2013
| ||||||||||||||||
| ||||||||||||||||
Indian Stock Markets Closing Reports(10-May-2013)
Main features of today trading are as follows
Ratios
Index Options Put Call Ratio: 1.01
Total Options Put Call Ratio: 0.97
Nifty P/E Ratio(10-May-2013): 18.07
Advances & Declines
BSE Advances : 1,199
BSE Declines : 1,233
NSE Advances : 700
NSE Declines : 712
Nifty Open Interest Changed Today
Nifty- 5800 CE(May)- -33,050(-1.53%)
Nifty- 5800 PE(May)- -135,850(-1.49%)
Nifty- 5900 CE(May)- -519,600(-14.58%)
Nifty- 5900 PE(May)- 218,500(3.08%)
Nifty- 6000 CE(May)- -308,650(-6.12%)
Nifty- 6000 PE(May)- 335,000(5.62%)
Nifty- 6100 CE(May)- 222,550(4.20%)
Nifty- 6100 PE(May)- 1,108,250(56.63%)
Nifty- 6200 CE(May)- 1,171,400(17.10%)
Nifty- 6200 PE(May)- 183,600(25.31%)
Closing
Sensex- closed at 20,082.62(143.58 Points & 0.72%)
Nifty- closed at 6,094.75(44.60 Points & 0.74%)
CNX Midcap - closed at 8,009.45(25.65 Points & 0.32%)
CNX Smallcap- closed at 3,070.15(21.15 Points & 0.69%)
Nifty Spot-Levels & Trading Strategy for 13-05-2013
Nifty Spot-Levels
R3 6201
R2 6157
R1 6132
Avg 6088
S1 6063
S2 6019
S3 5994
Nifty Spot-Trading Strategy
H6 6176 Trgt 2
H5 6160 Trgt 1
H4 6144 Long breakout
H3 6125 Go Short
H2 6119
H1 6113
L1 6100
L2 6094
L3 6088 Long
L4 6069 Short Breakout
L5 6053 Trgt 1
L6 6037 Trgt 2
Nifty(May Fut)-Levels & Trading Strategy for 13-05-2013
Nifty(May Fut)-Levels
R3 6233
R2 6181
R1 6149
Avg 6097
S1 6065
S2 6013
S3 5981
Nifty(May Fut)-Trading Strategy
H6 6203 Trgt 2
H5 6183 Trgt 1
H4 6164 Long breakout
H3 6141 Go Short
H2 6133
H1 6125
L1 6110
L2 6102
L3 6094 Long
L4 6071 Short Breakout
L5 6052 Trgt 1
L6 6032 Trgt 2
Bank Nifty(May Fut)-Levels & Trading Strategy for 13-05-2013
Bank Nifty(May Fut)-Levels
R3 13133
R2 12961
R1 12855
Avg 12683
S1 12577
S2 12405
S3 12299
Bank Nifty(May Fut)-Trading Strategy
H6 13032 Trgt 2
H5 12967 Trgt 1
H4 12901 Long breakout
H3 12825 Go Short
H2 12799
H1 12774
L1 12723
L2 12698
L3 12672 Long
L4 12596 Short Breakout
L5 12530 Trgt 1
L6 12465 Trgt 2
Mid-session Outlook(10-05-2013)
Nifty was trading at 6050 at 12:30 PM but moved sharply immediately after strong opening of European markets and today up moves were fuelled by strong up moves in US Futures also. As IIP numbers also improved therefore strong rally seen after its announcements. Now trading near the top of last resistance range(6050-6105) of on going rally. As today up moves are completely news based therefore finally sustaining above 6105 should be watched for strong rally above 6111.
Correcion on cards
 |
| Just click on chart for its enlarged view |
1- Selling between 6070-6082
2- Whole day actual trading between 6040-6082
Conclusions from intra day chart analysis
All trends are up and impulsive Wave-5 continuation but Indicators are overbought and suggesting for correction. Although complete selling patterns on daily charts are required for any deeper correction but Short Term correction is very much possible after any day higher levels intraday selling. As intraday selling patterns formations yesterday therefore minimum Short Term correction will be seen today.
Support were seen between 6024-6040 on 08-05-2013 and expected that Nifty will firstly trade within this range today. As higher levels selling yesterday therefore firstly sustaining beyond 6024 should be watched today for range bound correction between 6024-6083 or little deeper correction toward 5985.
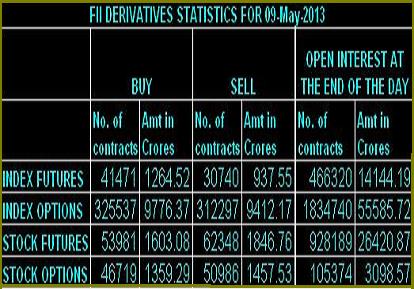
FII & DII trading activity in Capital Market Segment on 09-May-2013
| ||||||||||||||||
| ||||||||||||||||
Indian Stock Markets Closing Reports(09-May-2013)
Main features of today trading are as follows
Ratios
Index Options Put Call Ratio: 1.17
Total Options Put Call Ratio: 1.09
Nifty P/E Ratio(09-May-2013): 18.00
Advances & Declines
BSE Advances : 1,084
BSE Declines : 1,319
NSE Advances : 596
NSE Declines : 829
Nifty Open Interest Changed Today
Nifty- 5700 CE(May)- -14,100(-0.85%)
Nifty- 5700 PE(May)- 675,450(8.71%)
Nifty- 5800 CE(May)- -23,350(-1.07%)
Nifty- 5800 PE(May)- 326,450(3.71%)
Nifty- 5900 CE(May)- -293,350(-7.61%)
Nifty- 5900 PE(May)- 76,800(1.09%)
Nifty- 6000 CE(May)- 69,500(1.40%)
Nifty- 6000 PE(May)- 237,000(4.14%)
Nifty- 6100 CE(May)- 95,050(1.83%)
Nifty- 6100 PE(May)- 294,700(%)
Nifty- 6200 CE(May)- 610,350(9.78%)
Nifty- 6200 PE(May)- -10,850(-1.47%)
Closing
Sensex- closed at 19,939.04(-51.14 Points & -0.26%)
Nifty- closed at 6,050.15(-19.15 Points & -0.32%)
CNX Midcap - closed at 7,983.80(-58.35 Points & -0.73%)
CNX Smallcap- closed at 3,338.20(-8.85 Points & -0.26%)
Subscribe to:
Posts (Atom)