NIFTY-(Jan CE-6000)-Bought on 12-02-2013--Cover immediately-CMP-48(Lalit39)

ॐ ह्रीं श्रीं लक्ष्मीभयो नमः॥

Post-open Outlook(13-02-2013)
Although strong rally today but when Indian markets were in Red after weaker IIP data then also we did not posted Bearish views but on the contrary told for Up Moves:-
1- At 02:18 PM:- "intraday patterns are showing buying formations therefore up moves possibility above 5915 has increased"
2- At 12:59 PM:-"As market digested negative news and got support at lower levels today therefore until Nifty will not sustain below 5883 till then further down move will not be considered"
Strong rally today but equally strong resistances are between 5970-5984 and once sustaining above 5984 will mean fast up moves after Pre Budget Rally confirmations.
Pull Back rally on Cards
Nifty-Intra Day Chart (Feb 11 to Feb 13,2013):-
Technical Patterns and Formations in last 2 Sessions intraday charts
1- Consolidation between 5883-5900.
2- 2 Sessions most time trading between 5883-5915
3- 2 Sessions actual trading between 5883-5927
As 2 Sessions most time trading between 5883-5915 with lower levels good supports and consolidation patterns formations therefore this range broken out in last hour on 12-02-2013. Expected that Pull Back rally will be seen in the coming sessions but resistances are lying between 5930-5984 therefore fresh consolidation is required for sustaining above 5984 and market will take its complete time to complete consolidation process.
 |
| Just click on chart for its enlarged view |
1- Consolidation between 5883-5900.
2- 2 Sessions most time trading between 5883-5915
3- 2 Sessions actual trading between 5883-5927
Conclusions from 2 Sessions intra day chart analysis
As 2 Sessions most time trading between 5883-5915 with lower levels good supports and consolidation patterns formations therefore this range broken out in last hour on 12-02-2013. Expected that Pull Back rally will be seen in the coming sessions but resistances are lying between 5930-5984 therefore fresh consolidation is required for sustaining above 5984 and market will take its complete time to complete consolidation process.
Firstly Pull Back rally is expected and after sustaining above 5984 strong rally will be seen.
FII & DII trading activity in Capital Market Segment on 12-Feb-2013
| ||||||||||||||||
| ||||||||||||||||

Indian Stock Markets Closing Reports(12-Feb-2013)
1- Benchmark Indices closed in Green.
2- CNX Midcap and CNX Smallcap closed in Red.
3- White Candle formation.
Ratios
Index Options Put Call Ratio: 0.98
Total Options Put Call Ratio: 0.92
Nifty P/E Ratio(12-Feb-2013): 17.83
Advances & Declines
BSE Advances :
BSE Declines :
NSE Advances :
NSE Declines :
Nifty Open Interest Changed Today
Nifty- 5800 CE(Feb)- 45,850(6.02%)
Nifty- 5800 PE(Feb)- -35,800(-0.55%)
Nifty- 5900 CE(Feb)- -7,800(-0.29%)
Nifty- 5900 PE(Feb)- 365,600(5.32%)
Nifty- 6000 CE(Feb)- -30,450(-0.52%)
Nifty- 6000 PE(Feb)- 34,600(0.93%)
Nifty- 6000 CE(Feb)- -27,350 (-0.37%)
Nifty- 6000 PE(Feb)- -48,150(-3.09%)
Closing
Sensex- closed at 19561.04(100.47 Points & 0.52%)
Nifty- closed at 5,922.50(24.65 Points & 0.42%)
CNX Midcap - closed at 8,063.00(-30.35 Points & -0.37%)
CNX Smallcap- closed at 3,484.00(-11.65 Points & -0.33%)
Nifty Spot-Levels & Trading Strategy for 13-02-2013
R3 5978
R2 5952
R1 5937
Avg 5911
S1 5896
S2 5870
S3 5855
Nifty Spot-Trading Strategy
H6 5963 Trgt 2
H5 5953 Trgt 1
H4 5944 Long breakout
H3 5933 Go Short
H2 5929
H1 5925
L1 5918
L2 5914
L3 5910 Long
L4 5899 Short Breakout
L5 5890 Trgt 1
L6 5880 Trgt 2
Nifty(Feb Fut)-Levels & Trading Strategy for 13-02-2013
R3 6001
R2 5974
R1 5957
Avg 5930
S1 5913
S2 5886
S3 5869
Nifty(Feb Fut)-Trading Strategy
H6 5985 Trgt 2
H5 5975 Trgt 1
H4 5965 Long breakout
H3 5953 Go Short
H2 5949
H1 5945
L1 5936
L2 5932
L3 5928 Long
L4 5916 Short Breakout
L5 5906 Trgt 1
L6 5896 Trgt 2
Bank Nifty(Feb Fut)-Levels & Trading Strategy for 13-02-2013
R3 12649
R2 12559
R1 12508
Avg 12418
S1 12367
S2 12277
S3 12226
Bank Nifty(Feb Fut)-Trading Strategy
H6 12599 Trgt 2
H5 12567 Trgt 1
H4 12534 Long breakout
H3 12495 Go Short
H2 12482
H1 12469
L1 12444
L2 12431
L3 12418 Long
L4 12379 Short Breakout
L5 12346 Trgt 1
L6 12314 Trgt 2
NIFTY-Feb Call Option-Buying Trade
NIFTY-Feb Call Option(6000)-Buy-Positional-SL-24-TGT-64-CMP-42(Lalit39)
Pre-Closing Outlook(12-02-2013)
We never posted bearish views despite weaker IIP data but also told following lines:-
1- At 02:18 PM:- "intraday patterns are showing buying formations therefore up moves possibility above 5915 has increased"
2- At 12:59 PM:-"As market digested negative news and got support at lower levels today therefore until Nifty will not sustain below 5883 till then further down move will not be considered"
Last 2 days range broken out after lower levels good consolidations therefore more up moves are expected and strong rally will be seen after sustaining above next resistance
Mid-session Outlook-3(12-02-2013)
Although slipping from intraday high levels in last more than 90 minutes but intraday patterns are showing buying formations therefore up moves possibility above 5915 has increased but its valid break out should also be firstly watched.
Mid-session Outlook-2(12-02-2013)
As down moves after weaker IIP data were lacking required force therefore we did not projected more down moves and told for next moves confirmations through valid break out 5883-5915. Yesterday higher levels selling and lower levels supports were seen within mentioned range and today negative news generated volatility is being seen.
As market digested negative news and got support at lower levels today therefore until Nifty will not sustain below 5883 till then further down move will not be considered and valid break out above 5915 will mean rally possibility after on going correction completion strong indication.
As market digested negative news and got support at lower levels today therefore until Nifty will not sustain below 5883 till then further down move will not be considered and valid break out above 5915 will mean rally possibility after on going correction completion strong indication.
Mid-session Outlook(12-02-2013)
Trading between 5889-5912 today but down moves were lacking required force after the news of weaker IIP data and valid break out of yesterday trading range(5883-5915) should be firstly watched for next moves confirmations.
Next Trend Decider 5883-5915
Technical Analysis and Market Outlook
(12-02-2013)
Nifty-Intra Day Chart (11-Feb-2013):-(12-02-2013)
 |
| Just click on chart for its enlarged view |
1- Consolidation between 5883-5900.
2- 5 Waves of Bearish Rising Wedge formation.
3- Selling between 5907-5915
4- Whole day actual trading between 5883-5915.
Conclusions from intra day chart analysis
Just click following topic link and understand Daily Chart analysis:-
32 Points narrow range trading with lower level supports and consolidations and slipping also from higher levels after Bearish Rising Wedge formation and selling as well. As mixed intraday patterns formations within 5883-5915 today therefore its valid break out should be firstly watched tomorrow for following next decisive moves confirmations:-
1- 38.2%(5895) retracement completed on 08-02-2013 and sustaining below 5883 after follow up selling will mean testing possibility of next support at 5823.
2- Intraday support also seen near about 5895 today and sustaining above 5915 after follow up consolidation will mean Short Term Up moves possibility but on going correction completion confirmation will be above next resistance range(5930-5984).
Valid Break Out of 5883-5915 should be firstly watched tomorrow for next Trend confirmations.
FII & DII trading activity in Capital Market Segment on 11-Feb-2013
| ||||||||||||||||
| ||||||||||||||||
Indian Stock Markets Closing Reports(11-Feb-2013)
1- Benchmark Indices closed in Red.
2- Most Indices closed in Red but BANK NIFTY closed in Green.
3- Black Candle formation.
Ratios
Index Options Put Call Ratio: 0.87
Total Options Put Call Ratio: 0.83
Nifty P/E Ratio(11-Feb-2013): 17.72
Advances & Declines
BSE Advances : 1,222
BSE Declines : 1,616
NSE Advances : 622
NSE Declines : 897
Nifty Open Interest Changed Today
Nifty- 5700 CE(Feb)- -8,150(-2.76%)
Nifty- 5700 PE(Feb)- -591,600(-10.15%)
Nifty- 5800 CE(Feb)- 106,700(16.28%)
Nifty- 5800 PE(Feb)- 397,450(6.48%)
Nifty- 5900 CE(Feb)- 432,750(19.40%)
Nifty- 5900 PE(Feb)- -265,200(-3.72%)
Nifty- 6000 CE(Feb)- 319,300(5.73%)
Nifty- 6000 PE(Feb)- -330,600(-8.17%)
Closing
Sensex- closed at 19517(-24.20 Points & -0.12%)
Nifty- closed at 5,897.85(-5.65 Points & -0.10%)
CNX Midcap - closed at 8,093.35(-16.10 Points & -0.20%)
CNX Smallcap- closed at 3,495.65(-6.55 Points & -0.19%)
Nifty Spot-Levels & Trading Strategy for 12-02-2013
R3 5966
R2 5945
R1 5921
Avg 5900
S1 5876
S2 5855
S3 5831
Nifty Spot-Trading Strategy
H6 5942 Trgt 2
H5 5931 Trgt 1
H4 5921 Long breakout
H3 5909 Go Short
H2 5905
H1 5901
L1 5892
L2 5888
L3 5884 Long
L4 5872 Short Breakout
L5 5862 Trgt 1
L6 5851 Trgt 2
Nifty(Feb Fut)-Levels & Trading Strategy for 12-02-2013
R3 5969
R2 5953
R1 5937
Avg 5921
S1 5905
S2 5889
S3 5873
Nifty(Feb Fut)-Trading Strategy
H6 5953 Trgt 2
H5 5945 Trgt 1
H4 5938 Long breakout
H3 5929 Go Short
H2 5926
H1 5923
L1 5918
L2 5915
L3 5912 Long
L4 5903 Short Breakout
L5 5896 Trgt 1
L6 5888 Trgt 2
Bank Nifty(Feb Fut)-Levels & Trading Strategy for 12-02-2013
R3 12533
R2 12476
R1 12432
Avg 12375
S1 12331
S2 12274
S3 12230
Bank Nifty(Feb Fut)-Trading Strategy
H6 12489 Trgt 2
H5 12466 Trgt 1
H4 12443 Long breakout
H3 12415 Go Short
H2 12406
H1 12397
L1 12378
L2 12369
L3 12360 Long
L4 12332 Short Breakout
L5 12309 Trgt 1
L6 12286 Trgt 2
Mid-session Outlook-4(11-02-2013)
First 4 hours consolidation patterns and last 1 hour Bearish Rising Wedge formation therefore mixed intraday patterns formations and today trading range(5883-5915) valid break out shold be firstly watched tomorrow for next moves confirmations.
Mid-session Outlook-3(11-02-2013)
4 hours trading between 5883-5910 with lower levels supports and consolidations patterns but complete consolidations is required for any decisive up move because multiple resistances at higher levels. As supports and consolidations seen near about 38.2% retracement level(5895) today therefore Short Term up moves expectations turned alive but firstly sustaining above 5910(today trading range high) and after that 5984(resistance) is must for any decisive up move confirmation. As correction is already on and fresh selling will mean fast down moves toward next 50.0% retracement level(5829).
For next move confirmation firstly valid break out of 5883-5910 should be watched.
Mid-session Outlook-2(11-02-2013)
As intraday supports with consolidations patterns indications near about 38.2% retracement level(5895) therefore up moves expectations turned alive from here but complete consolidations is required because multiple resistances at higher levels and sustaining above 5905 will be Short Term Up move confirmation.
Mid-session Outlook(11-02-2013)
Although most time negative zone trading with continuous new intraday lows formations but intraday consolidations patterns indications also therefore up moves expectations are still alive.
Post-open Outlook(11-02-2013)
Nifty is hovering around 38.2% retracement level(5895) and follow up positions near it about will tell about correction continuation toward 50.0% retracement level(5829) or up moves after complete consolidations because multiple resistances at higher levels.
Today first hour trading between 5893-5905 with intraday consolidations patterns indications and expected that Nifty will trade some more time near about this range. Let market prepare for next moves then will be updated according to intraday charts formations and it should be kept in mind that down moves will be sharp but up moves will be slow up to 5984.
Today first hour trading between 5893-5905 with intraday consolidations patterns indications and expected that Nifty will trade some more time near about this range. Let market prepare for next moves then will be updated according to intraday charts formations and it should be kept in mind that down moves will be sharp but up moves will be slow up to 5984.
Pre-open Outlook(11-02-2013)
All the Asian markets are closed today therefore Indian markets will take sentiment from US markets which closed positive last Friday. Short term Indicators are oversold after previous week sharp fall and resistances between 5930-5984 therefore fresh consolidation is required for sustaining above mentioned range and market will take complete time to complete consolidation process.
Pre-Budget Rally after Correction Completion
Technical Analysis,Research & Weekly Outlook
(Feb 11 to Feb 15,2013)
Nifty-EOD Chart (08-Feb-2013):- |
| Just click on chart for its enlarged view |
1- 4531.15 on 20-12-2011(Rally beginning after 13 Months correction completion)
2- Wave-1(5629.95 on 22-02-2012)
3- Wave-2(4770.35 on 04-06-2012)
4- Wave-3 continuation(4770.35 on 04-06-2012)
5- Sub Wave-1 gained 578.20 points(5348.55 on 10-07-2012)
6- Sub Wave-2(5032.40 on 26-07-2012)
7- Sub Wave-3 gained 782.95 points(5815.35 on 05-10-2012)
8- Sub Wave-4(5548.35 on 20-11-2012)
9- Sub Wave-5(6111.80 on 29-01-2013)
Conclusions from EOD chart analysis
Correction continuation after Sub Wave-5 completion and its recent bottom formation at 5883.65 on 08-02-2013. Sub-Wave-5 started from 5548 and completed at 6111 and its Fibonacci retracement levels are as follows:-
38.2%- 5895
50.0%- 5829
61.8%- 5763
38.2%(5895) retracement has been completed on 08-02-2013 but closing was above it at 5903.50 and slipping below it will mean testing possibility of next support at 5823 as well as next retracement level at 5829.
As strong supports(5823)are lying near 50 %(5829) retracement levels therefore high possibility of correction completion and up moves beginning from near about these levels and will be certainly considered if intraday charts will start to show consolidations there. Expected that consolidation will start near about 5823 or above it in next week and Pre-Budget Rally will commence after on going correction completion.
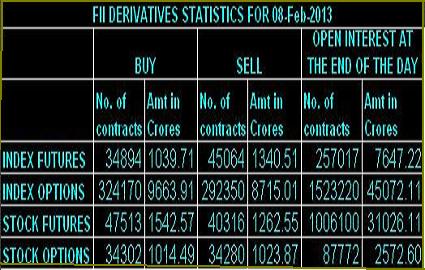
FII & DII trading activity in Capital Market Segment on 08-Feb-2013
| ||||||||||||||||
| ||||||||||||||||
Indian Stock Markets Closing Reports(08-Feb-2013)
1- All the Indices closed in Red except CNX INFRA and CNX IT.
2- Closing at the lowest of the day.
3- Black Candle formation.
Ratios
Index Options Put Call Ratio: 0.96
Total Options Put Call Ratio: 0.90
Nifty P/E Ratio(08-Feb-2013): 17.75
Advances & Declines
BSE Advances : 1,005
BSE Declines : 1,837
NSE Advances : 449
NSE Declines : 1,077
Nifty Open Interest Changed Today
Nifty- 5700 CE(Feb)- -6,650(-2.20%)
Nifty- 5700 PE(Feb)- -344,600(-5.58%)
Nifty- 5800 CE(Feb)- 147,200(28.96%)
Nifty- 5800 PE(Feb)- 736,300(%)
Nifty- 5900 CE(Feb)- 648,450(40.99%)
Nifty- 5900 PE(Feb)- 1,055,450(17.36%)
Nifty- 6000 CE(Feb)- 885,350(18.89%)
Nifty- 6000 PE(Feb)- -213,400(-5.01%)
Nifty- 6100 CE(Feb)- 268,550(3.61%)
Nifty- 6100 PE(Feb)- -57,150(-3.31%)
Closing
Sensex- closed at 19,484.77(-95.55 Points & -0.49%)
Nifty- closed at 5,903.50(-35.30 Points & -0.59%)
CNX Midcap - closed at 8,109.45(-62.35 Points & -0.76%)
CNX Smallcap- closed at 3,502.20(-32.60 Points & -0.92%)
Nifty Spot-Levels & Trading Strategy for 11-02-2013
R3 6013
R2 5983
R1 5943
Avg 5913
S1 5873
S2 5843
S3 5803
Nifty Spot-Trading Strategy
H6 5973 Trgt 2
H5 5957 Trgt 1
H4 5941 Long breakout
H3 5922 Go Short
H2 5915
H1 5909
L1 5896
L2 5890
L3 5883 Long
L4 5864 Short Breakout
L5 5848 Trgt 1
L6 5832 Trgt 2
Nifty(Feb Fut)-Levels & Trading Strategy for 11-02-2013
R3 6035
R2 6004
R1 5962
Avg 5931
S1 5889
S2 5858
S3 5816
Nifty(Feb Fut)-Trading Strategy
H6 5994 Trgt 2
H5 5977 Trgt 1
H4 5961 Long breakout
H3 5941 Go Short
H2 5934
H1 5927
L1 5914
L2 5907
L3 5900 Long
L4 5880 Short Breakout
L5 5864 Trgt 1
L6 5847 Trgt 2
Bank Nifty(Feb Fut)-Levels & Trading Strategy for 11-02-2013
R3 12567
R2 12508
R1 12428
Avg 12369
S1 12289
S2 12230
S3 12150
Bank Nifty(Feb Fut)-Trading Strategy
H6 12487 Trgt 2
H5 12455 Trgt 1
H4 12424 Long breakout
H3 12386 Go Short
H2 12373
H1 12360
L1 12335
L2 12322
L3 12309 Long
L4 12271 Short Breakout
L5 12240 Trgt 1
L6 12208 Trgt 2
Nifty Spot-Weekly Levels & Trading Strategy(Feb 11 to Feb 15,2013)
R3 6156
R2 6097
R1 6000
Avg 5941
S1 5844
S2 5785
S3 5688
Nifty Spot-Weekly Trading Strategy
H6 6059 Trgt 2
H5 6024 Trgt 1
H4 5988 Long breakout
H3 5945 Go Short
H2 5931
H1 5917
L1 5888
L2 5874
L3 5860 Long
L4 5817 Short Breakout
L5 5781 Trgt 1
L6 5746 Trgt 2
Bank Nifty Spot-Weekly Levels & Trading Strategy(Feb 11 to Feb 15,2013)
R3 13065
R2 12894
R1 12587
Avg 12416
S1 12109
S2 11938
S3 11631
Bank Nifty Spot-Weekly Trading Strategy
H6 12759 Trgt 2
H5 12651 Trgt 1
H4 12542 Long breakout
H3 12411 Go Short
H2 12367
H1 12323
L1 12236
L2 12192
L3 12148 Long
L4 12017 Short Breakout
L5 11908 Trgt 1
L6 11800 Trgt 2
NIFTY-Feb Call Option(6000)-Positional Buying of 07-02-2013-Covering
NIFTY-Feb Call Option(6000)-Positional Bought on 07-02-2013-Cover immediately-CMP-38(Lalit39)
Mid-session Outlook(08-02-2013)
Although market slipped from higher levels and also trading below yesterday lowest but intraday patterns are not suggesting selling but on the contrary showing consolidation formations therefore up moves continuation hopes are still alive with same expectations which were updated yesterday in previous Outlook.
Up Moves after Correction Completion Today
Nifty-Intra Day Chart (07-Feb-2013):-
1- Support between 5928-5938
2- Down moves in Bullish Falling Channel
3- Whole day actual trading between 5928-5978
 |
| Just click on chart for its enlarged view |
Technical Patterns and Formations in today intraday charts
1- Support between 5928-5938
2- Down moves in Bullish Falling Channel
3- Whole day actual trading between 5928-5978
Conclusions from intra day chart analysis
Although previous support at 5941 broken down and trading below it also today but Whole day down moves in Bullish Falling Channel as well as lower levels supports therefore fresh up moves will begin from tomorrow and Nifty will trade between 6000-6100 in the coming sessions after correction completion today.

FII & DII trading activity in Capital Market Segment on 07-Feb-2013
| ||||||||||||||||
| ||||||||||||||||
Indian Stock Markets Closing Reports(07-Feb-2013)
1- All the Indices closed in Red except CNX IT and CNX AUTO.
2- Slipping after weaker GDP data.
3- Inverted Hammer/Gravestone Doji Bullish formation.
Ratios
Index Options Put Call Ratio: 0.91
Total Options Put Call Ratio: 0.86
Nifty P/E Ratio(07-Feb-2013):17.85
Advances & Declines
BSE Advances : 966
BSE Declines : 1,868
NSE Advances : 445
NSE Declines : 1,043
Nifty Open Interest Changed Today
Nifty- 5700 CE(Feb)- -12,300(-3.91%)
Nifty- 5700 PE(Feb)- 226,050(3.79%)
Nifty- 5800 CE(Feb)- 53,200(11.48%)
Nifty- 5800 PE(Feb)- 873,700(18.87%)
Nifty- 5900 CE(Feb)- 210,500(15.20%)
Nifty- 5900 PE(Feb)- 918,550(17.19%)
Nifty- 6000 CE(Feb)- 707,150(17.51%)
Nifty- 6000 PE(Feb)- 103,250(2.47%)
Nifty- 6100 CE(Feb)- 1,056,850(16.51%)
Nifty- 6100 PE(Feb)- -113,850(-6.17%)
Closing
Sensex- closed at 19,580.32(-59.40 Points & -0.30%)
Nifty- closed at 5,938.80(-20.40 Points & -0.34%)
CNX Midcap - closed at 8,171.80(-66.45 Points & -0.81%)
CNX Smallcap- closed at 3,534.80(-44.80 Points & -1.25%)
Nifty(Feb Fut)-Levels & Trading Strategy for 08-02-2013
R3 6040
R2 6016
R1 5988
Avg 5964
S1 5936
S2 5912
S3 5884
Nifty(Feb Fut)-Trading Strategy
H6 6013 Trgt 2
H5 6001 Trgt 1
H4 5989 Long breakout
H3 5975 Go Short
H2 5970
H1 5965
L1 5956
L2 5951
L3 5946 Long
L4 5932 Short Breakout
L5 5920 Trgt 1
L6 5908 Trgt 2
Bank Nifty(Feb Fut)-Levels & Trading Strategy for 08-02-2013
R3 12680
R2 12606
R1 12512
Avg 12438
S1 12344
S2 12270
S3 12176
Bank Nifty(Feb Fut)-Trading Strategy
H6 12586 Trgt 2
H5 12548 Trgt 1
H4 12510 Long breakout
H3 12464 Go Short
H2 12448
H1 12433
L1 12402
L2 12387
L3 12371 Long
L4 12325 Short Breakout
L5 12287 Trgt 1
L6 12249 Trgt 2
NIFTY-Feb Call Option-Buying Trade
NIFTY-Feb Call Option(6000)-Positional-SL-34-TGT-78-CMP-56(Lalit39)
Pre-Closing Outlook(07-02-2013)
Although down moves after weaker GDP data and now again slipped below 5941 but today down moves are without required force and in Bullish Falling Channel also therefore view is not bearish despite trading below 5941. Sustaining below today lows will be watched tomorrow for next down moves confirmations because lower levels supports seen today.
Mid-session Outlook(07-02-2013)
Although sharp fall in CNX MIDCAP,CNX SMALLCAP and Nifty is trading below 5941 after loosing all intraday gains but negative news led down moves therefore view will be Bearish after sustaining below 5941 for next down moves toward 55823.
FY 13 GDP Growth forecast at 5%
As GDP below expectations therefore sentiment dampened and market slipped from intraday higher levels. Although all the positive and negative impact will be discounted within 5941-5984 and its valid break out will give next moves confirmation but down moves after GDP News are not forceful therefore view has not turned Bearish yet.
Post-open Outlook-3(07-02-2013)
As intraday charts showed consolidation patterns also despite higher levels selling and closing at lowest of the day yesterday therefore Indian markets are up while most Asian markets are in Red today.
We did not posted Bearish views yesterday and told for valid break out of 5941-5984 for next trend confirmation. As good recovery from lower levels today therefore sustaining above 5984 should be firstly watched now for correction completion and Short term up moves confirmation.
We did not posted Bearish views yesterday and told for valid break out of 5941-5984 for next trend confirmation. As good recovery from lower levels today therefore sustaining above 5984 should be firstly watched now for correction completion and Short term up moves confirmation.
Subscribe to:
Posts (Atom)