Sustaining beyond last 30 sessions trading range(24379-25222) will be finally
according to escalation or de-escalation
of Israel and Iran war
Technical Analysis,Research & Weekly
Outlook(Jun 23 to Jun 27,2025)
Nifty-EOD Chart Analysis
(Waves structure)
Nifty-EOD Chart (20-Jun-2025):-

Technical Patterns and Formations in EOD charts
1- Corrective Wave-C of previous Waves structure "ABC correction" completion at 15183.40 on 17-06-2022 and Impulsive Wave-1 of new Waves structure beginning.
2- Impulsive Wave-1 completion at 18887.60 on 01-12-2022.
3- Corrective Wave-2 completion at 16828.30 on 20-03-2023.
4- Impulsive Wave-(i) of Wave-3 completion at 20222.45 on 15-09-2023 and Wave-A of "ABC" correction beginning.
5- Wave-A of Wave-(ii) of Wave-3 completion at 19333.60 on 04-10-2023.
6- Wave-B of Wave-(ii) of Wave-3 completion at 19849.80 on 17-10-2023.
7- Wave-C of Wave-(ii) of Wave-3 completion at 18837.80 on 26-10-2023 and impulsive Wave-(iii) of Wave-3 beginning.
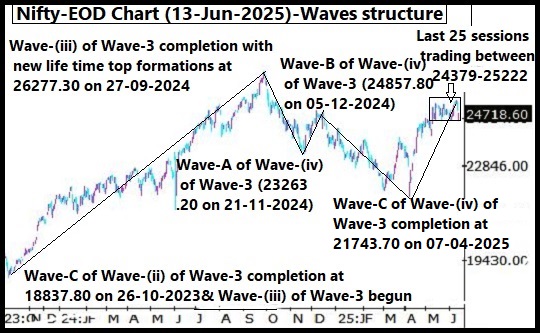
8- Impulsive Wave-(iii) of Wave-3 completion with new life time top formations at 26277.30 on 27-09-2024 and Corrective Wave-A of Wave-(iv) of Wave-3 of "ABC" correction beginning.
9- Corrective Wave-A of Wave-(iv) of Wave-3 completion at 23263.20 on 21-11-2024.
10- Corrective Wave-B of Wave-(iv) of Wave-3 completion at 24857.80 on 05-12-2024.
11- Corrective Wave-C of Wave-(iv) of Wave-3 completion at 21743.70 on 07-04-2025 and Wave-(v) of Wave-3 beginning from this level.
12- Impulsive Wave-(v) of Wave-3 continuation with recent top formations at 25222.40 on 11-06-2025.
13- Last 30 sessions trading between 24379-25222.
Conclusions from EOD chart analysis
(Waves structure)
Impulsive Wave-1 of new Waves structure started from 15183.40 on 17-06-2022 after Corrective Wave-C of "ABC correction" of previous waves structure completion at this level. Wave-1 completed at 18887.60 on 01-12-2022 and corrective Wave-2 begun from this level which completed at 16828.30 on 20-03-2023 and impulsive Wave-(i) of Wave-3 started from this level.
Impulsive Wave-(i) of Wave-3 completed at 20222.40 on 15-09-2023 and from this level corrective Wave-A of "ABC" correction of Wave-(ii) of Wave-3 begun which completed at 19333.60 on 04-10-2023. Wave-B started from this level which completed at 19849.80 on 17-10-2023 and Wave-C begun which completed at 18837.80 on 26-10-2023. Impulsive Wave-(iii) of Wave-3 started from this level which completed with new life time top formations at 26277.30 on 27-09-2024 and corrective Wave-A of Wave-(iv) of Wave-3 begun from this level.
Corrective Wave-A of Wave-(iv) of Wave-3 completed at 23263.20 on 21-11-2024 and Wave-B of Wave-(iv) of Wave-3 started from this levels which completed at 24857.80 on 05-12-2024. From this levels corrective Wave-C of Wave-(iv) of Wave-3 begun which completed at 21743.70 on 07-04-2025 and Wave-(v) of Wave-3 started from this level. Now impulsive Wave-(v) of Wave-3 continuation with recent top formations at at 25222.40 on 11-06-2025 and no confirmation of its completion yet on EOD charts. Last 30 sessions trading between 24379-25222 and finally sustaining beyond this range will confirm next trend formations as well as that side bigger decisive moves beginning will be seen after valid break out of such 30 sessions like bigger trading range break out confirmations.
Nifty-EOD Chart Analysis
(Stochastic & MACD)
Nifty-EOD Chart (20-Jun-2025):-

Technical Patterns and Formations in EOD charts
1- Stochastic- %K(5) line has intersected %D(3) line upward and its both lines are rising towards Over bought zone.
2- Stochastic:- %K(5)- 68.10 & %D(3)- 58.41.
3- In MACD- Its both MACD line and Average line are kissing in positive zone.
4- MACD(26,12)- 87.06 & EXP(9)- 70.47 & Divergence- 16.59
Conclusions from EOD chart analysis
(Stochastic & MACD)
Technical positions of Short Term indicators are as follows:-
1- As in Stochastic indicator its %K(5) line has intersected %D(3) line upward and its both lines are rising towards Over bought zone therefore it will be understood that at present this indicator is signalling more upward moves possibility in the coming week.
2- As in MACD indicator its both MACD line and Average line are kissing in positive zone therefore it will be understood that at present this indicator is not showing any side decisive moves beginning signal. Let any side clear intersection happen then that side decisive moves will be seen after that side Short Term trend formation confirmations.
Nifty-EOD Chart Analysis
(Averages)
Nifty-EOD Chart (20-Jun-2025):-

Technical Patterns and Formations in EOD charts
Averages:-
1- 5-Day SMA is today at 24903(Very Short Term Trend decider)
2- 21-Day SMA is today at 24863(Short Term Trend decider)
3- 55-Day SMA is today at 24334(Intermediate Term Trend decider)
4- 100-Day SMA is today at 23726
5- 200-Day SMA is today at 24077(Long Term Trend decider)
Conclusions from EOD chart analysis
(Averages)
As Nifty is hovering near about Very Short Term and Short Term Trends decider 5-Day and 21-Day SMAs for the last 23 sessions therefore these 2 Trends at stake. Nifty is trading well above Intermediate Term and Long Term Trends deciding 55-Day and 200-Day SMAs for the last more than 2 months therefore these 2 Trends are up.
Nifty-Intra Day Chart Analysis
(20-Jun-2025)
Nifty-Intra Day Chart (20-Jun-2025):-

Technical Patterns formation in today intraday charts
1- Consolidation between 24814-24890
2- Sharp up
3- Consolidation between 24965-25062
4- Sharp up
5- Whole day trading between 24784-25136
Conclusions from intra day
chart analysis
Although negative zone opening but lower levels consolidation developed therefore sharp upward moves were seen after that. As again more than 4 hours follow up consolidation therefore sharp upward moves developed in last hour also.
As only intraday consolidation patterns formations last Friday therefore more upward moves are expected in the beginning of next week.
Conclusions
(After putting all studies together)
1- Short Term Trend is at stake.
2- Intermediate Term Trend is up.
3- Long Term Trend is up.
Corrective Wave-C of "ABC correction" of previous waves structure completed at 15183.40 on 17-06-2022 and from this level impulsive Wave-1 of that Waves structure started,its impulsive Wave-(iii) of Wave-3 completed after new life time top formations at 26277.30 on 27-09-2024. From this level corrective Wave-A of Wave-(iv) of Wave-3 of "ABC" correction begun of which Wave-C completed at 21743.70 on 07-04-2025 and impulsive Wave-(v) of Wave-3 started from this leveL. Although now impulsive Wave-(v) of Wave-3 continuation with recent top formations at 25222.40 on 11-06-2025 and no confirmation of its completion yet on EOD charts also but last 30 sessions like larger period trading between 24379-25222 and finally sustaining it beyond should be watched in the coming week/weeks for next one sided bigger moves beginning confirmations after that side next Trend formation.
Averages are suggesting that Very Short Term and Short Term Trends at stake but Intermediate Term and Long Term Trends are up therefore if finally Nifty will be able to sustain above last 30 sessions range highest(25222) then impulsive Wave-(v) of Wave-3 may test and move above life time top at 26277.30.
Although at present Short Term indicator MACD is not signalling any side decisive moves beginning possibility but another Short Term indicator Stochastic is indicating last Friday started upward moves continuation possibility in the coming week and good intraday consolidation was seen last Friday also therefore firstly sustaining beyond following next resistances of last 30 sessions trading range should be watched in the coming week for next decisive moves beginning confirmations.
1-25131-25148
2-25202-25222
Donald Trump has proved that he is the most unpredictable person in this World and taken a U-Turn after White House announcement that US will directly attack or not on Iran, it will be decided within 2 weeks. All the Global Financial Markets reacted on this decision in their own manner. Most Commodities markets were down and Stock markets were up last Friday according to the implications of his this decision on Israel and Iran war.
Although Israel and Iran war situations are changing on daily basis and Stock Markets will react on it accordingly also but it is confirm that finally sustaining beyond or forceful break out/down of last 30 sessions trading range will confirm next one side bigger moves beginning. As next one sided bigger moves will be according to war escalation or de-escalation situation therefore finally last 30 sessions trading range(24379-25222) should be watched for its beginning confirmations and till then Nifty will remain sideways within this range.