Finally sustaining beyond Long Term Trend decider 200-Day SMA(today at 24050) will generate next one sided bigger moves
Technical Analysis,Research & Weekly
Outlook(Apr 21 to Apr 25,2025)
Nifty-EOD Chart Analysis
(Waves structure)
Nifty-EOD Chart (17-Apr-2025):-

Technical Patterns and Formations in EOD charts
1- Wave-C of Wave-(ii) of Wave-3 completion at 18837.80 on 26-10-2023 and impulsive Wave-(iii) of Wave-3 beginning.
2- Impulsive Wave-(iii) of Wave-3 completion with new life time top formations at 26277.30 on 27-09-2024 and Corrective Wave-A of Wave-(iv) of Wave-3 of "ABC" correction beginning.
3- Corrective Wave-A of Wave-(iv) of Wave-3 completion at 23263.20 on 21-11-2024.
4- Corrective Wave-B of Wave-(iv) of Wave-3 completion at 24857.80 on 05-12-2024.
5- Corrective Wave-C of Wave-(iv) of Wave-3 continuation with recent bottom formations at 21743.70 on 07-04-2025 and Pull Back Rally beginning from this level.
6- Pull Back Rally continuation with recent top formations at 23872.35 on 17-04-2025.
Conclusions from EOD chart analysis
(Waves structure)
Impulsive Wave-(iii) of Wave-3 started from 18837.80 on 26-10-2023 after Wave-C of Wave-(ii) of Wave-3 completion at this level which completed with new life time top formations at 26277.30 on 27-09-2024 and from this level corrective Wave-A of Wave-(iv) of Wave-3 of "ABC" correction begun.
Corrective Wave-A of Wave-(iv) of Wave-3 completed at 23263.20 on 21-11-2024 and from this level Wave-B of Wave-(iv) of Wave-3 started which completed at 24857.80 on 05-12-2024 and from this level corrective Wave-C of Wave-(iv) of Wave-3 begun which is now in continuation with it recent bottom formations at 21743.70 on 07-04-2025. Pull Back Rally started from this level which is now in continuation with its recent top formations at 23872.35 on 17-04-2025.
Nifty-EOD Chart Analysis
(Stochastic & MACD)
Nifty-EOD Chart (17-Apr-2025):-

Technical Patterns and Formations in EOD charts
1- Stochastic- %K(5) line has intersected %D(3) line upward and its both lines are rising in Over bought zone.
2- Stochastic:- %K(5)- 98.31 & %D(3)- 86.47.
3- In MACD- MACD line has intersected Average line downward and its both lines are falling in positive and negative zone.
4- MACD(26,12)- -86.89 & EXP(9)- 164.75 & Divergence- -251.64
Conclusions from EOD chart analysis
(Stochastic & MACD)
Technical positions of Short Term indicators are as follows:-
1- As in Short Term indicator Stochastic its %K(5) line has intersected %D(3) line upward and its both lines are rising in Over bought zone therefore it will be understood that this indicator is now completely Over bought but downward intersection not happen therefore some more upward possibility can not be ruled out. Let its lines to move below Over bought zone after downward intersection then Short Term correction will be seen.
2- As in MACD indicator its MACD line has intersected Average line downward and its both lines are falling in positive and negative zone therefore it will be understood that this indicator is still showing Short Term downward trend formations and resultant downward moves beginning possibility can not be ruled out.
Nifty-EOD Chart Analysis
(Averages)
Nifty-EOD Chart (17-Apr-2025):-

Technical Patterns and Formations in EOD charts
Averages:-
1- 5-Day SMA is today at 23169(Very Short Term Trend decider)
2- 21-Day SMA is today at 23138(Short Term Trend decider)
3- 55-Day SMA is today at 22987(Intermediate Term Trend decider)
4- 100-Day SMA is today at 23395
5- 200-Day SMA is today at 24050(Long Term Trend decider)
Conclusions from EOD chart analysis
(Averages)
As 2128 points strong rally in the last 7 sessions therefore Short and Intermediate Term Trends have tuned up because Nifty has moved and closed above both these trends deciders 21-Day and 55-Day SMA forcefully in previous week. Long Term Trend is still down because its decider 200-Day SMA is 199 points above its previous week closing. Firstly sustaining beyond 200-Day SMA should be watched in the coming week/weeks for next Long Term Trend formation confirmations and next bigger moves beginning also according to its formations.
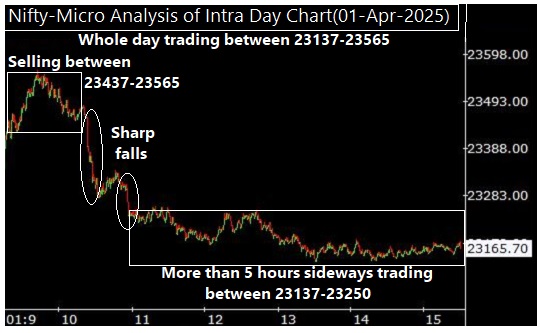
Nifty-Intra Day Chart Analysis
(17-Apr-2025)
Nifty-Intra Day Chart (17-Apr-2025):-

Technical Patterns formation in today intraday charts
1- Consolidation in first 2 hours between 23299-23445
2- Strong and sharp upward moves in whole Mid-Session
3- Consolidation in last 2 hours between 23785-23872
4- Whole day trading between 23299-23872
Conclusions from intra day chart analysis
Although firstly downward moves after negative opening and Nifty traded 138 down also but lower levels good consolidation developed in first 2 hours therefore strong and sharp upward moves were seen in whole Mid-Session. As higher levels again consolidation in last 2 hours between 23785-23872 therefore it will be understood that whole day good intraday consolidation developed last Thursday hence on going Rally continuation is expected in the beginning of next week also.
Conclusions (After putting all studies together)
1- Short Term Trend is up.
2- Intermediate Term Trend is up.
3- Long Term Trend is down.
Corrective Wave-A of Wave-(iv) of Wave-3 of "ABC" correction started after impulsive Wave-(iii) of Wave-3 completion with new life time top formations at 26277.30 on 27-09-2024. Now its corrective Wave-C of Wave-(iv) of Wave-3 in continuation with recent bottom formations at 21743.70 on 07-04-2025 and no confirmation of its completion also on EOD charts. Pull Back Rally begun from this level which is also in continuation with recent top formations at 23872.35 on 17-04-2025 and no indication of its completion on EOD charts.
As Short Term indicator Stochastic is signalling on going Short Term Upward moves continuation possibility and intraday charts of last Thursday are also showing whole day intraday consolidation patterns formations therefore on going Pulll Back Rally will remain continued in the beginning of next week but remain cautions because Stochastic is completely Over Bought and if intraday charts starts to show fresh selling patterns formations then Short Term correction may also begin. Although strong rally in last 7 sessions but another Short Term indicator MACD is still showing Short Term downward trend formations therefore fresh Short Term downward moves beginning possibility can not be ruled out in the coming week/weeks.
As Long Term Trend is still down despite 2128 points strong rally in the last 7 sessions therefore firstly sustaining beyond its decider 200-Day SMA(today at 24050) should be watched in the coming week/weeks for:-
1- Finally sustaining above its decider 200-Day SMA will mean fresh strong rally of impulsive Wave-(v) of Wave-3 beginning and all the Trends turning up after corrective Wave-C of "ABC" correction of Wave-(iv) of Wave-3 completion at 21743.70 on 07-04-2025
2- Finally sustaining below its decider 200-Day SMA will mean fresh downward moves beginning towards the bottom(21743.70) of on going Pull Back Rally