ॐ ह्रीं श्रीं लक्ष्मीभयो नमः॥


Trading "calls" from our "Software" with more than "90% accuracy"

More than "12 years" old "only site of whole world" 
with more than "9700 accurate Outlooks" of 
"Indian Stock Markets" 
Strong rally after huge Victory of 
our greatest Prime Minister Modi ji 
on 4th June 2024
Technical Analysis,Research & Weekly Outlook
(Jun 03 to Jun 07,2024)
Nifty-EOD Chart Analysis
(Waves structure)
Nifty-EOD Chart (31-May-2024):-
Technical Patterns and Formations in EOD charts

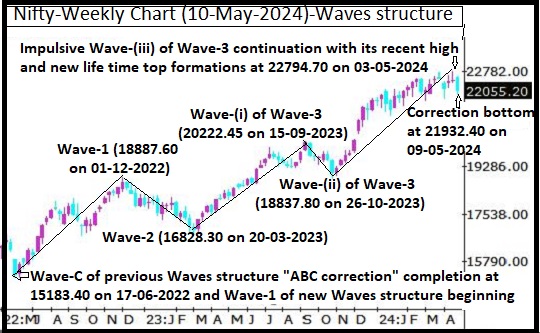
1- Impulsive Wave-(i) of Wave-3 completion at  20222.45 on 15-09-2023 and Wave-A of "ABC" correction beginning.
2- Wave-A of Wave-(ii) of Wave-3 completion at 19333.60 on 04-10-2023.
3- Wave-B of Wave-(ii) of Wave-3 completion at 19849.80 on 17-10-2023.  
4- Corrective Wave-C of Wave-(ii) of Wave-3 completion at 18837.80 on 26-10-2023 and impulsive Wave-(iii) of Wave-3 beginning. 
5- Impulsive Wave-(iii) of Wave-3 continuation with its recent high and new life time top formations at 23110.80 on 27-05-2024.
6- Short Term correction continuation with recent bottom formations at 22417.00 on 30-05-2024

Conclusions from EOD chart analysis
(Waves structure)

Impulsive Wave-(i) of Wave-3 completed at 20222.45 and from this level corrective Wave-A of "ABC" correction of Wave-(ii) of Wave-3 started which completed at 19333.60 on 04-10-2023 and Wave-B begun. Wave-B completed at 19849.80 on 17-10-2023 and Wave-C started from this levels which completed at 18837.80 on 26-10-2023 and impulsive Wave-(iii) of Wave-3 begun from this level. 

Now Impulsive Wave-(iii) of Wave-3 is in continuation with its recent high and new life time top formations at 23110.80 on 27-05-2024 and no confirmation of its completion yet on EOD charts. Short Term correction begun from life time top which is in continuation and no confirmation of its completion also on EOD charts therefore firstly sustaining beyond its recent bottom(22417.00) should be watched in the beginning of coming week for on going Short Term correction continuation/completion confirmations.

Nifty-EOD Chart Analysis
(Stochastic & MACD)
Nifty-EOD Chart (31-May-2024):-
Technical Patterns and Formations in EOD charts

1- More than 5 months old Rising Channel Pattern formations and Nifty closed near its higher Rising Channel line in previous week.
2- Stochastic- %K(5) line has intersected %D(3) line downward and its both lines are falling towards Over sold zone.
3- Stochastic:- %K(5)- 16.86 & %D(3)- 34.71.
4- In MACD- MACD line has intersected Average line upward and its both lines are rising in positive zone.
5- MACD(26,12)- 236.11 & EXP(9)- 124.54 & Divergence- 111.57

Conclusions from EOD chart analysis
(Stochastic & MACD)

More than 5 months old Rising Channel Pattern formations and Nifty closed almost in the middle  of  Rising Channel last Friday therefore it will be understood that at present it is not showing any side immediate break out/down signal. Let it happen then that side big moves will begin which should be firstly watched in the coming week/weeks for its confirmations. Technical positions of Short Term indicators are as follows;-
 
1- As in Stochastic its %K(5) line has intersected %D(3) line downward and its both lines are falling towards Over sold zone therefore as per this indicator little more down moves can not be ruled out before fresh up moves beginning.

2- As in MACD indicator MACD line has intersected Average line upward and its both lines are rising in positive zone therefore it will be understood that this indicator has confirmed Upward Trend formations and resultant strong rally will be seen.

Nifty-Last 9 Sessions
intraday charts analysis
Nifty-Intra Day Chart (May 21 to May 31,2024):-
Technical Patterns formation in last 9 Sessions intraday charts

1- Selling(Resistances) in last 9 Sessions are as follows:-
A- 22744-22767
B- 22793-22825
C- 22937-22988
D- 23054-23110
2- Consolidation(Supports) in last 9 Sessions are as follows:-
A- 21417-21502
B- 21502-21582
3- Last 9 Sessions actual trading between 21405-23111 

Conclusions from 9 Sessions
intra day chart analysis 

Last 9 Sessions actual trading between 21405-23111 with above mentioned supports and resistances. As lower levels fresh consolidation was seen in last 2 sessions of previous week therefore firstly up moves are expected towards above mentioned resistances but finally sustaining beyond last 9 sessions trading range should be watched in the coming week/weeks for next big moves beginning confirmations.

Nifty-Intra Day Chart Analysis
(31-May-2024)
Nifty-Intra Day Chart (31-May-2024):-
Technical Patterns formation in today intraday charts

1- Up moves after positive opening
2- Selling between 22618-22653
3- Down moves
4- Consolidation between 22502-22559
5- Volatility between 22548-22628
6- Consolidation between 22466-22547
7- Whole day actual trading between 22466-22653

Conclusions from intra day chart analysis 

Although firstly up moves after positive opening but higher levels selling developed in first half hour therefore down moves started and Nifty lost almost all intraday gains. As more than 3 hours consolidation in Mid-sessions and follow up consolidation also in last hour after some volatility therefore up moves are expected above last Friday highest(22653.75) in the beginning of next week.

Conclusions (After putting
all studies together)

1- Long Term trend is up.
2- Intermediate Term trend is up.
3- Short Term Trend is down.

Although Impulsive Wave-(iii) of Wave-3 continuation with new life time top formations and no confirmation of its completion yet on EOD charts but Short Term correction started from life time top level which is in continuation and no confirmation of its completion also.

As intraday charts of last 2 sessions are showing lower levels supports and Short Term indicator Stochastic has also moved into Oversold zone as well as MACD indicator has confirmed Upward Trend formations therefore finally up moves are expected towards above mentioned 4 resistances in the coming week. Firstly sustaining beyond life time highest(23110.80) should be watched in the coming week for strong rally beginning after huge Victory of our greatest Prime Minister Modi ji on 4th June 2024.
Sustaining above above 22615 
will mean strong rally
Nifty-Intra Day Chart Analysis & 
Market Outlook(31-05-2024)
Nifty-Intra Day Chart (30-May-2024):-
Technical Patterns formation in today intraday charts

1- Down moves after weaker opening
2- Consolidation between 22540-22615
3- Supports between 22417-22502 
4- Whole day actual trading between 22417-22705

Conclusions from intra day chart analysis 

As Dow Jones Futures was trading more than 250 points down before the opening of Indian markets and all the Asian markets were also trading in Red therefore firstly down moves were seen after weaker opening. More than 3 hours consolidation in  Mid-Session and lower levels supports also therefore finally up moves are expected and sustaining above above 22615 will mean strong rally beginning.
Finally sustaining above 22703 will 
confirm Fresh Rally beginning after
 Short Term correction completion
Nifty-Intra Day Chart Analysis & 
Market Outlook(30-05-2024)
Nifty-Intra Day Chart (29-May-2024):-
Technical Patterns formation in today intraday charts

1- Selling between 22793-22825
2- Sharp down
3- Consolidation between 22686-22686
4- Sharp up
5- Selling between 22767-22744
6- Down moves in Bullish Falling Channel
7- Whole day actual trading between 22686-22825

Conclusions from intra day chart analysis 

As Bearish Global cues therefore firstly weaker opening of Indian markets and after that fresh selling developed hence 2 times sharp down moves were seen. Although lower levels consolidation and after that sharp up moves also but again follow up selling developed therefore again down moves started which remained continued till last minutes but these more than one hour down moves were in Bullish Falling Channel which is a consolidation pattern also hence whole day intraday trading will be understood with lower levels consolidation and higher levels selling patterns formations.

2nd Supports between 22657-22703 was posted at 08.17 AM on 29-05-2024 in "Watch next supports amid Bearish Global cues" and Nifty closed just above this range at 22704.45 after intraday lowest also formations within this supports range at 22685.45 today. As intraday supports were seen within this supports range and 22685.45 also therefore firstly sustaining above this supports range should be watched in the coming sessions for fresh rally beginning after on going Short Term correction completion.

Watch next supports amid 
Bearish Global cues 
Pre-open Outlook(29-05-2024)

Sentiment turned dampened today morning because:-

1- Dow Jones closed .55% down yesterday.
2- Dow Jones Futures is trading more than 80 points down today morning.
3- All the Asian markets are trading in Red and some are more than 1% down today morning.

As above mentioned Bearish Global cues today morning and resultant negative opening will be seen today therefore firstly sustaining beyond following next supports should be watched for next sharp up moves beginning confirmations because whole day consolidation was seen yesterday through down moves in Bullish Falling Channels:-

1- 22816-22844
2- 22657-22703
Finally up moves after fresh consolidation
Nifty-Intra Day Chart Analysis & 
Market Outlook(29-05-2024)
Nifty-Intra Day Chart (28-May-2024):-
Technical Patterns formation in today intraday charts

1- Whole day down moves in Bullish Falling Channels
2- Whole day actual trading between 22859-22998

Conclusions from intra day chart analysis 

Although firstly up moves after positive opening but down moves started which remained continued till last minutes. As wholle day down moves were in Bullish Falling Channel which is a consolidation pattern therefore finally up moves will be seen above today highest after fresh consolidation in the coming 1/2 sessions.
Finally sustaining beyond 22872-23110 will confirm next decisive moves beginning
Nifty-Intra Day Chart Analysis & 
Market Outlook(28-05-2024)
Nifty-Intra Day Chart (27-May-2024):-
Technical Patterns formation in today intraday charts

1- Consolidation between 22942-23009
2- Sharp up
3- Selling between 23054-23110
4- Sharp down
5- Whole day actual trading between 22872-23110

Conclusions from intra day chart analysis 

As firstly consolidation after positive opening therefore sharp up moves were seen after that but higher levels selling therefore sharp down moves developed in last hour. Whole day mixed Patterns formation between 22872-23110 therefore Nifty will firstly trade and prepare for next decisive moves within and near about today trading range. Finally sustaining beyond today trading range will confirm next decisive moves beginning therefore it should be watched  in the coming session for one sided next decisive moves beginning confirmations.
Finally rally with Pre Election results confusions led Volatility & after Short Term correction completion
Technical Analysis,Research & Weekly Outlook
(May 27 to May 31,2024)
Nifty-EOD Chart Analysis
(Waves structure)
Nifty-EOD Chart (24-May-2024):-
Technical Patterns and Formations in EOD charts

1- Corrective Wave-C of previous Waves structure "ABC correction" completion at 15183.40 on 17-06-2022 and Impulsive Wave-1 of new Waves structure beginning.
2- Impulsive Wave-1 completion at 18887.60 on 01-12-2022.
3- Corrective Wave-2 completion at 16828.30 on 20-03-2023.
4- Impulsive Wave-(i) of Wave-3 completion at  20222.45 on 15-09-2023 and Wave-A of "ABC" correction beginning.
5- Wave-A of Wave-(ii) of Wave-3 completion at 19333.60 on 04-10-2023.
6- Wave-B of Wave-(ii) of Wave-3 completion at 19849.80 on 17-10-2023.  
7- Corrective Wave-C of Wave-(ii) of Wave-3 completion at 18837.80 on 26-10-2023 and impulsive Wave-(iii) of Wave-3 beginning. 
8- Impulsive Wave-(iii) of Wave-3 continuation with its recent high and new life time top formations at 23026.40 on 24-05-2024.

Conclusions from EOD chart analysis
(Waves structure)

Impulsive Wave-1 of new Waves structure started from 15183.40 on 17-06-2022 after Corrective Wave-C of "ABC correction" of previous Waves structure completion at this level. Corrective Wave-2 begun from this level which completed at 16828.30 on 20-03-2023. Impulsive Wave-3 started from this level.

Wave-A of "ABC" correction begun from 20222.45 after Impulsive Wave-(i) of Wave-3 completion at this level. Finally Wave-C of "ABC" correction completed at 18837.80 which means that Corrective Wave-(ii) of Wave-3 completion. Impulsive Wave-(iii) of Wave-3 started from this level which is in continuation with its recent high and new life time top formations at 23026.40 on 24-05-2024 and no indication of its completion yet on EOD charts.
 
Nifty-EOD Chart Analysis
(Stochastic & MACD)
Nifty-EOD Chart (24-May-2024):-
Technical Patterns and Formations in EOD charts

1- More than 4 months old Rising Channel Pattern formations and Nifty closed near its higher Rising Channel line in previous week.
2- Stochastic- Its both lines %K(5) and %D(3) are kissing in Over bought zone.
3- Stochastic:- %K(5)- 93.11 & %D(3)- 93.03.
4- In MACD- MACD line has intersected Average line upward and its both lines are rising in positive and negative zone.
5- MACD(26,12)- 101.50 & EXP(9)- -55.18 & Divergence- 156.68

Conclusions from EOD chart analysis
(Stochastic & MACD)

More than 4 months old Rising Channel Pattern formations and Nifty closed near its higher Rising Channel line in previous week therefore firstly valid break out of its higher rising line should be watched in the coming week for next bigger moves beginning confirmations because coming week is Pre Election results week and may be highly volatile also.Technical positions of Short Term indicators are as follows;-
 
1- As in Stochastic its both lines %K(5) and %D(3) are kissing in Over bought zone therefore it will be understood that at present this indicator is not showing any side bigger moves beginning confirmations. Its both lines are Kissing mode for the last more than one week and slipping below Over bought zone after downward intersection will mean Short Term correction beginning confirmations therefore it should be watched for its confirmations. 

2- As in MACD indicator MACD line has intersected Average line upward and its both lines are rising in positive and negative zone therefore it will be understood that this indicator has started to show signals of Upward Trend formations. Let its both lines to start upward moves in Positive Zone then strong rally will be seen after its Upward Trend formation confirmations.

Nifty-Intra Day Chart Analysis
(24-May-2024)
Nifty-Intra Day Chart (24-May-2024):-
Technical Patterns formation in today intraday charts

1- Whole day trading with Mixed Patterns formation between 22918-23026
2- Whole day actual trading between 22908-23026

Conclusions from intra day chart analysis 

Although more than 100 points recovery was seen from lower levels after little weaker opening and new life time top formations also but lower levels some consolidation and higher levels some selling was also seen last Friday. As whole day trading was with Mixed Patterns formation between 22918-23026 therefore expected that Nifty will firstly trade and prepare for next Short Term Trend within and near about this trading range in the beginning of next week. Finally sustaining beyond 22918-23026 will confirm next Short Term Trend therefore should be watched for its confirmations in the next week.

Conclusions
(After putting all studies together)

1- Long Term trend is up.
2- Intermediate Term trend is up.
3- Short Term Trend is up.

Impulsive Wave-(iii) of Wave-3 continuation with its recent high and new life time top formations at 23026.40 in previous session and no indication of its completion yet on EOD charts.

Nifty is trading for the last more than 4 months within Rising Channel pattern and Nifty closed near its higher Rising line in previous week. Previous life time top was formed at 22794.70 on 03-05-2024 and after 13 sessions this life time top was forcelly broken out on 23-05-2024 with that day new life time top formations at 22993.60 and 369 Points(1.64%) points intraday gains. As such strong break out happened after completion of 5th phase of pooling therefore it will be understood that Indian marekts operaors have found confirm cues of BJP big victory in Parliament Elections 2024.

As Short Term indicator Stochastic is showing signals of Short Term correction which may also be seen but until Nifty will not sustain below the lower rising line of Rising Channel pattern till then decisive down moves will not be seen. As MACD indicator has started to indicate upward trend formations therefore expected that finaaly up moves will be seen after Short Term correction completion. First strong signal of any side Short term moves beginning will come after sustaining beyond 22918-23026 in which Nifty traded almost whole day with Mixed Patterns formation last Friday.

As next week is Pre Election results week and its results confusion led valatility may also be seen therefore firstly sustaining beyond following supports should be watched one by one for next decisive moves beginning confirmations amid finally rally beginning expectations after expected Short Term correction completion near about any of the following supports range:-

1- 22887-22931
2- 22816-22844
3- 22657-22703
4- 22527-22883
5- 22444-22485
6- 22357-22403
7- 22055-22106
Fresh rally continuation after emergence of BJP led NDA huge victory expectations
Nifty-Intra Day Chart Analysis & 
Market Outlook(24-05-2024)
Nifty-Intra Day Chart (23-May-2024):-
Technical Patterns formation in today intraday charts

1- Whole day up moves with downward corrections
2- Whole day actual trading between 22578-22993

Conclusions from intra day chart analysis 

As huge victory of BJP led NDA had been ascertained from internal election sources after 5th phase of pooling last Monday therefore firstly Nifty consolidated in first 2 sessions of this week and decisive strong rally started after flat opening today. Whole day up moves were with downward corrections and new life time top formations forcefully with 1.64% intraday gains today therefore on going fresh rally will remain continued after emergence of BJP led NDA huge victory expectations.
 As still out of station and not returned yet therefore unable to update today(23-05-2024) Outlook but coming Friday Outkook will be posted positively. 
 As out of station therefore unable 
to post today(22-05-2024) Outlook. 
Down ward moves expectations 
towards next supports
Technical Analysis,Research & Weekly Outlook
(May 21 to May 24,2024)
Nifty-EOD Chart Analysis
(Waves structure)
Nifty-EOD Chart (17-May-2024):-
Technical Patterns and Formations in EOD charts

1- Impulsive Wave-(i) of Wave-3 beginning from 16828.30 on 20-03-2023 after Corrective Wave-2 completion at this level.
2- Impulsive Wave-(i) of Wave-3 completion at  20222.45 on 15-09-2023 and Wave-A of "ABC" correction beginning.
3- Wave-A of Wave-(ii) of Wave-3 completion at 19333.60 on 04-10-2023.
4- Wave-B of Wave-(ii) of Wave-3 completion at 19849.80 on 17-10-2023.  
5- Corrective Wave-C of Wave-(ii) of Wave-3 completion at 18837.80 on 26-10-2023 and impulsive Wave-(iii) of Wave-3 beginning. 
6- Impulsive Wave-(iii) of Wave-3 continuation with its recent high and new life time top formations at 22794.70 on 03-05-2024.
7- More than 2 months trading with 3 times new life time top formations and 3 times Short Term corrections between 21711-22794

Conclusions from EOD chart analysis
(Waves structure)

Corrective Wave-2 completed at 16828.30 on 20-03-2023 and from this level Impulsive Wave-(i) of Wave-3 begun which completed at  20222.45 and Wave-A of "ABC" correction started from this level which completed at 19333.60 and Wave- B begun from this level. Wave-B completed at 19849.80 and from this level Wave-C begun which completed at 18837.80.  

Impulsive Wave-(iii) of Wave-3 started from 18837.80 on 26-10-2023 which is in continuation with its recent high and new life time top formations at 22794.70 on 03-05-2024 as well as no confirmation of its completion yet on EOD charts. As more than 2 months trading with 3 times new life time top formations and 3 times Short Term corrections also between 21711-22794 therefore finally sustaining beyond this range should be watched in the coming week/weeks for next bigger moves beginning confirmations.

Nifty-Weekly Chart Analysis
(Stochastic & MACD)
Nifty-Weekly Chart (17-May-2024):-
Technical Patterns and Formations in Weekly charts

1- Stochastic- %K(5) line has intersected %D(3) line downward and its both lines are falling towards Over sold zone.
2- Stochastic:- %K(5)- 54.54 & %D(3)- 55.32.
3- In MACD- MACD line has intersected Average line downward and its both lines are falling in positive zone.
4- MACD(26,12)- 342.21 & EXP(9)- 695.05 & Divergence- -352.84

Conclusions from Weekly chart analysis
(Stochastic & MACD)

Technical positions of Intermediate Term indicators are as follows;-

1- As in Weekly Stochastic indicator its %K(5) line has intersected %D(3) line downward and its both lines are falling towards Over sold zone also therefore finally decisive downward moves are expected in the coming week/weeks.
2- As in Weekly MACD indicator its  MACD line has intersected Average line downward and its both lines are falling in positive zone therefore it will be understood that MACD is confirming Downward trend formations and resultant deeper correction beginning is expected in the coming week/weeks. 

Nifty-EOD Chart Analysis
(Stochastic & MACD)
Nifty-EOD Chart (17-May-2024):-
Technical Patterns and Formations in EOD charts

1- More than 3 months old Rising Channel Pattern formations and Nifty closed within Rising Channel Pattern in previous week.
2- Stochastic- %K(5) line has intersected %D(3) line upward and its both lines are rising towards Over bought zone.
3- Stochastic:- %K(5)- 89.34 & %D(3)- 78.44.
4- In MACD- MACD line has intersected Average line downward and its both lines are falling in negative zone.
5- MACD(26,12)- -110.19 & EXP(9)- -49.11 & Divergence- -61.08

Conclusions from EOD chart analysis
(Stochastic & MACD)

More than 3 months old Rising Channel Pattern formations and Nifty closed within Rising Channel Pattern in previous week therefore finally valid break out/down of its upper rising line or lower rising line should be watched for next bigger moves beginning confirmations.

1- %K(5) line has intersected %D(3) line upward and its both lines are rising towards Over bought zone therefore it will be understood that Short Term up moves are almost mature and let clear downward moves beginning signals develop through downward intersection and slipping below Overbought zone that  decisive downward moves will be seen.
3- As in MACD indicator its MACD line has intersected Average line downward and its both lines are falling in negative zone therefore it will be understood that this indicator has shown stronger signals of Downward Trend formations as well as finally higher possibility of downward moves beginning after downward trend formations.

Nifty-Intra Day Chart Analysis
(17-May-2024)
Nifty-Intra Day Chart (17-May-2024):-
Technical Patterns formation in today intraday charts

1- Up moves with downward corrections in first 2 hours. 
2- More than 4 hours trading with selling patterns formations between 22442-22491.
3- Whole day actual trading between 22346-22502.

Conclusions from intra day chart analysis 

Although firstly slipping after positive opening last friday but up moves were seen with downward corrections in first 2 hours. As more than 4 hours trading was with selling patterns formations also therefore expected that firstly down moves will be seen towards last Friday lowest in the beginning of next week.

Conclusions
(After putting all studies together)

1- Long Term trend is up.
2- Intermediate Term trend is up.
3- Short Term Trend is up.

Impulsive Wave-(iii) of Wave-3 continuation with its recent high and new life time top formations at 22794.70 on 03-05-2024 as well as no confirmation of its completion yet on EOD charts but:-

1- More than 2 months trading with 3 times new life time top formations and 3 times Short Term corrections also between 21711-22794 as well as Nifty has closed little above half way mark within this range therefore it will be understood that at present Nifty is not prepared for any side decisive moves beginning. 
2- More than 3 months old Rising Channel Pattern formations and Nifty closed within Rising Channel Pattern in previous week.

Firstly Nifty will have to trade and prepare for next decisive moves beginning between 21711-22794 which will be done in next week. Finally sustaining this range and upper/lower rising line of Rising Channel Pattern should be watched in the coming week/weeks for next bigger moves beginning confirmations.

As Intermediate and Short Term indicators are also showing more possibility of Short Term correction beginning as well as last Friday intraday charts are also showing intraday selling patterns formations therefore firstly down ward moves are expected towards following next supports in the beginning of next week:- 

1- 22349-22401
2- 22055-22154
3- 21827-21891
5- 21711-21791
4- 21653-21690
6- 21544-21628

Next resistances are as follows:-

1- 22442-22536
2- 22674-22702
3- 22733-22783

Watch next resistances amid more more 
up moves expectations
Nifty-Intra Day Chart Analysis & 
Market Outlook(17-05-2024)
Nifty-Intra Day Chart (16-May-2024):-
Technical Patterns formation in today intraday charts

1- Down moves in Bullish Falling Channel
2- Volatility between 22150-22298
3- Down moves in Bullish Falling Channel
4- Sharp up moves in last 2 hours
3- Whole day actual trading between 22055-22432

Conclusions from intra day chart analysis 

Although strong opening but not sustaining at higher levels and down moves begun which remained continued more than 4 hours as well as Nifty traded in negative zone also. As whole day down moves were in Bullish Falling Channel therefore sharp up moves begun which remained continued in last 2 hours as well as Nifty closed near intraday highest. 

As whole day only intraday consolidation patterns formations and intraday selling patterns were not seen therefore up moves are expected towards following next resistances as well as sustaining beyond these resistances should be watched in the coming sessions next decisive moves beginning confirmations:-

1- 22482-22536
2- 22674-22702
Finally sustaining beyond 22152-22247 will confirm next intraday decisive moves beginning
Nifty-Intra Day Chart Analysis & 
Market Outlook(16-05-2024)
Nifty-Intra Day Chart (15-May-2024):-
Technical Patterns formation in today intraday charts

1- Sharp fall in first hour
2- More than 5 hours sideways trading between 22152-22247
3- Whole day actual trading between 22152-22297

Conclusions from intra day
 chart analysis 

Although firstly up moves after flat opening but sharp fall was seen in first hour. As more than 5 hours sideways trading between 22152-22247 and one sided intraday patterns were not seen within this trading range therefore NIifty will firstly trade and prepare for next decisive moves within and near about this trading range. Finally sustaining beyond 22152-22247 should be watched in the coming session for next intraday decisive moves beginning confirmations.
Finally sustaining beyond 22200-22270 will confirm next intraday decisive moves beginning
Nifty-Intra Day Chart Analysis & Market Outlook(15-05-2024)
Nifty-Intra Day Chart (14-May-2024):-
Technical Patterns formation in today intraday charts

1- Consolidation between 22082-22154
2- Up moves with downward corrections
3- Selling between 22217-22270
4- Whole day actual trading between 22082-22270

Conclusions from intra
day chart analysis 

Although firstly slipping after positive opening but consolidation developed in first 2 hours therefore up moves started which were with downward corrections therefore consolidation will be understood in Mid-session also. As higher levels some selling also in last 2 hours therefore expected that:-

1- Nifty will firstly trade within and near about 22200-22270 and 
2- Finally sustaining beyond this range will confirm next decisive moves beginng 
3- Hence sustaining beyond this range should be watched in the coming sessions for next intraday decisive moves beginning confirmations.
 As busy therefore unable 
to post today(14-05-2024) Outlook. 
Watch levels one by one amid finally 
down moves expectations
Technical Analysis,Research & Weekly Outlook
(May 13 to May 17,2024)
Nifty-Weekly Chart Analysis
(Waves structure)
Nifty-Weekly Chart (10-May-2024):-
Technical Patterns and Formations in EOD charts

1- Corrective Wave-C of previous Waves structure "ABC correction" completion at 15183.40 on 17-06-2022 and Impulsive Wave-1 of new Waves structure beginning.
2- Impulsive Wave-1 completion at 18887.60 on 01-12-2022.
3- Corrective Wave-2 completion at 16828.30 on 20-03-2023.
4- Impulsive Wave-(i) of Wave-3 completion at 20222.45 on 15-09-2023
5- Corrective Wave-(ii) of Wave-3 completion at 18837.80 on 26-10-2023
6- Impulsive Wave-(iii) of Wave-3 continuation with its recent high and new life time top formations at 22794.70 on 03-05-2024.
7- Short Term correction continuation with its recent bottom formations at 21932.40 on 09-05-2024.
 
Conclusions from Weekly chart analysis
(Waves structure)

Corrective Wave-C of previous Waves structure completed at 15183.40 and Impulsive Wave-1 of new Waves structure started from this level. Now impulsive Wave-(iii) of Wave-3 of on going Waves structure is in continuation with its recent high and new life time top formations at 22794.70 on 03-05-2024 and no confirmation of its completion yet on Weekly charts. Short Term correction begun from this level which is in continuation with its recent bottom formations at 21932.40 on 09-05-2024 and no confirmation of its completion yet also on Weekly Charts. As in previous week long Weekly candle formations with closing near the lowest of previous week therefore emergence of more downward moves beginning signals will be understood and view has turned cautious. 

Nifty-Weekly Chart Analysis
(Stochastic & MACD)
Nifty-Weekly Chart (10-May-2024):-
Technical Patterns and Formations in Weekly charts

1- Last 8 weeks(33 Sessions) trading from 20-03-2024 to 10-05-2024 and between 21711-22794 with 2 Short Term Corrections bottom formations at 21717.70 on 19-04-2024 and 21932.40 on 09-05-2024.
2- Previous week closing at the lowest of last 8 weeks(33 Sessions)
2- Stochastic- %K(5) line has intersected %D(3) line downward and its both lines are falling from Over bought zone.
3- Stochastic:- %K(5)- 53.43 & %D(3)- 57.29.
4- Stochastic is showing negative divergence.
5- In MACD- MACD line has intersected Average line downward and its both lines are falling in positive zone.
6- MACD(26,12)- 384.61 & EXP(9)- 767.49 & Divergence- -382.88.
7- MACD is showing negative divergence.

Conclusions from Weekly chart analysis
 (Stochastic & MACD)

As short Term correction continuation with previous week closing at the lowest of last 8 weeks(33 Sessions) therefore it will be understood that on going correction continuation signals have been emerged. Technical positions of Intermediate Term indicators are as follows;-

1- As in Weekly Stochastic indicator its %K(5) line has intersected %D(3) line downward and its both lines are falling towards Over sold zone as well as this indicator is showing negative divergence also therefore decisive downward moves are expected in the coming week/weeks.
2- As in Weekly MACD indicator its  MACD line has intersected Average line downward and its both lines are falling in positive zone as well as this indicator is showing negative divergence also therefore it will be understood that MACD is confirming Downward trend formations and resultant deeper correction beginning possibility also in the coming week/weeks. 

Nifty-EOD Chart Analysis
(Stochastic & MACD)
Nifty-EOD Chart (10-May-2024):-
Technical Patterns and Formations in EOD charts

1- More than 3 months old Rising Channel Pattern formations 
2- Nifty closed below lower rising line of Rising Channel Pattern for the last 2 sessions.
3- Stochastic- Both lines %K(5) and %D(3) are kissing in Over sold zone.
4- Stochastic:- %K(5)- 13.82 & %D(3)- 14.26.
5- In MACD- Both MACD line and Average line are kissing near about Zero Line
6- MACD(26,12)- -22.91 & EXP(9)- 23.53 & Divergence- -46.44
7- MACD is showing negative divergence

Conclusions from EOD chart analysis
(Stochastic & MACD)

More than 3 months old Rising Channel Pattern formations and last 2 sessions closing was below its lower rising line therefore now only first signal of decisive downward moves beginning will be understood.  Technical positions of Short Term indicators are as follows:-

1- As in Stochastic indicator its both lines %K(5) and %D(3) are kissing in Over sold zone therefore it will be understood that at present this indicator is not showing any side decisive moves beginning signals.
3- As in MACD indicator its both MACD line and Average line are kissing near about Zero Line therefore it will be understood that now it is not showing clear signals any side Trend formation. 

Let any side clear intersection happen in both Stochastic and MACD indicators then that side Short Term moves will be seen. As MACD is showing negative divergence also therefore higher possibility of decisive downward moves beginning will be understood after Downward trend formations in the coming week/weeks

Nifty-EOD Chart Analysis
(Averages)
Nifty-EOD Chart (10-May-2024):-
Technical Patterns and Formations in EOD charts

Averages:-

1- 5-Day SMA is today at 22212 
2- 21-Day SMA is today at 22381
3- 55-Day SMA is today at 22284
4- 100-Day SMA is today at 21992
5- 200-Day SMA is today at 20846

Conclusions from EOD chart analysis
(Averages)

As Nifty has closed below Short Term Trend deciders(5-Day and 21-Day SMA) in last 4 sessions of previous week therefore Short Term Trend is at stake and Nifty has closed below Intermediate Term Trend decider(55-Day SMA) in the last 3 sessions of previous week therefore Intermediate Term Trend will also be understood at stake. Although Long Term trend is up but both other Trends are at stake. As Nifty is closing near about 100-Day SMA for the last 2 sessions therefore firstly sustaining it beyond should be watched in the coming week/weeks for next bigger moves beginning and next Trend formation confirmations

Nifty-Intra Day Chart Analysis
(10-May-2024)
Nifty-Intra Day Chart (10-May-2024):-
Technical Patterns formation in today intraday charts

1- 140 Points up moves after positive opening
2- Selling between 22062-22131
3- Down moves in Bullish Falling Channel
4- Consolidation between 22009-22037
3- Whole day actual trading between 21951-22131

Conclusions from intra day chart analysis 

Although firstly 140 points up moves after positive opening but selling developed in first 2 hours therefore down moves started and Nifty slipped more than 100 points as well as traded below 22000. As these down moves were in Bullish Falling Channel which is a consolidation pattern and after that consolidation was seen in sideways trading range also therefore whole day last Friday trading will be understood with higher levels selling and lower levels consolidation.

As whole day mixed intraday trading Patterns formation between 21951-22131 last Friday therefore expected that Nifty will firstly trade and prepare for next decisive moves within and near about last Friday trading range in the beginning of next week. Finally sustaining beyond last Friday trading range will confirm next decisive moves beginning therefore it should be watched in the coming sessions for one sided next decisive moves beginning confirmations. 

Conclusions
(After putting all studies together)

1- Long Term trend is up.
2- Intermediate Term trend at stake.
3- Short Term Trend is at stake.

Although now impulsive Wave-(iii) of Wave-3 continuation with its recent high and new life time top formations at 22794.70 and no confirmation of its completion yet but Short Term correction begun from this level which is in continuation with its recent bottom formations at 21932.40 on 09-05-2024 and no confirmation of its completion also yet. 

As Intermediate Term indicators are showing clear signals of correction continuation therefore more down moves are expected but Short Term indicators not showing clear signals hence some up moves can not be ruled out. Finally down moves are expected and firstly following levels should be watched one by one in the coming week/weeks for next decisive moves beginning confirmations;-

1- 21951- Last Friday lowest because some intraday supports was seen above it that day.
2- 21992- 100-Day SMA because Nifty is closing near about it for the last 2 sessions and it will finally confirm the life of Short and Intermediate Term trends which are now at stake.
3- 21778- Bottom of previous Short Term correction
4- 21711- Bottom of Last 8 weeks(33 Sessions)

As correction continuation expectations therefore following next supports below previous session closing should be watched one by one in the coming week/weeks:-

1- 21886-22037
2- 21795-21860
3- 21711-21791
4- 21653-21690
5- 21544-21628

Resistances above previous session closing is as follows:-

1- 22062-22131
2- 22132-22183
3- 22281-22368
4- 22482-22536
5- 22674-22702
6- 22733-22783

Finally 21795-22183 will confirm 
next bigger moves
Nifty-Intra Day Chart Analysis & 
Market Outlook(10-05-2024)
Nifty-Intra Day Chart (09-May-2024):-
Technical Patterns formation in today intraday charts

1- Down moves with upward correction
2- Selling between 22122-22183
3- Selling between 22021-22078
4- Down moves in Bullish Falling Channel
5- Whole day actual trading between 21933-22307

Conclusions from intra day chart analysis 

Although firstly up moves after weaker opening but fresh selling started which remained continued more than 5 hours through Down moves with upward correction and 2 times within sideways trading. As some intraday consolidation also in last hour through Down moves in Bullish Falling Channel which was within supports range also therefore some up moves are expected towards above mentioned selling ranges. Until complete fresh will not develop till then more down moves will not be seen because following supports are also lying below today closing. Expected that Nifty will trade within above mentioned selling ranges and following supports in the coming sessions and will prepare for next bigger moves as well as finally sustaining beyond 21795-22183 will confirm these next bigger moves:- 

1- 21886-22027
2- 21795-21860
Down moves expectations
Nifty-Intra Day Chart Analysis & 
Market Outlook(09-05-2024)
Nifty-Intra Day Chart (08-May-2024):-
Technical Patterns formation in today intraday charts

1- Volarility in first 2 hours after weaker opening
2- Up moves in Bearish Rising Channel
3- Selling Patterns formation in last 4 hours between 22281-22368
4- Whole day actual trading between 22186-22368

Conclusions from intra day chart analysis 

Although firstly some down moves after weaker opening and Nifty slipped more than 100 points also but Nifty got supports just below yesterday mentioned next 1st supports 22199-22258 at 22,185.20 today. As up moves in Bearish Rising Channel in Mid-session after first 2 hours volatility and after that selling Patterns formation in last 4 hours also therefore whole day good intraday selling will be understood and down moves are expected in the coming sessions.
Down moves towards next Supports
Nifty-Intra Day Chart Analysis & 
Market Outlook(08-05-2024)
Nifty-Intra Day Chart (07-May-2024):-
Technical Patterns formation in today intraday charts

1- Down moves with upward corrections after positive opening
2- More than 4 hours trading with selling Patterns formation between 22233-22327
3- Whole day actual trading between 22233-22499

Conclusions from intra day chart analysis 

Although positive opening but selling started through down moves with upward corrections and lower levels more than 4 hours trading with selling Patterns also therefore whole day good intraday selling will be understood and resultant down moves are expected below day's lowest(22233) and towards following next supports in the coming sessions:-

1- 22199-22258
2- 21886-22027
Finally sustaining beyond 22349-22536
 will confirm next trend
Nifty-Intra Day Chart Analysis &
 Market Outlook(07-05-2024)
Nifty-Intra Day Chart (06-May-2024):-
Technical Patterns formation in today intraday charts

1- Volatility in first half hour after positive opening.
2- Sharp fall
3- More than 5 hours trading with mixed Patterns formation between 22410-22536
4- Whole day actual trading between 22410-22588

Conclusions from intra day chart analysis 

Although firstly some up moves after positive opening but firstly volatility in first half hour and after that sharp fall was seen because higher levels good intraday selling last Friday hence Nifty could not sustain at higher levels.

Supports were seen between 22349-22494 last Friday and Nifty traded within and near about this range today also with mixed Patterns formation between 22410-22536 therefore Nifty will firstly trade and prepare for next trend within and near about 22349-22536 in the coming sessions. As finally sustaining beyond 22349-22536 will confirm next trend therefore should be watched for its confirmations.
Finally Downward moves towards
 next Supports
Technical Analysis,Research & Weekly Outlook
(May 06 to May 10,2024)
Nifty-EOD Chart Analysis
(Waves structure)
Nifty-EOD Chart (03-May-2024):-
Technical Patterns and Formations in EOD charts

1- Corrective Wave-C of previous Waves structure "ABC correction" completion at 15183.40 on 17-06-2022 and Impulsive Wave-1 of new Waves structure beginning.
2- Impulsive Wave-1 completion at 18887.60 on 01-12-2022.
3- Corrective Wave-2 completion at 16828.30 on 20-03-2023.
4- Impulsive Wave-(i) of Wave-3 completion at  20222.45 on 15-09-2023 and Wave-A of "ABC" correction beginning.
7- Wave-A of Wave-(ii) of Wave-3 completion at 19333.60 on 04-10-2023.
8- Wave-B of Wave-(ii) of Wave-3 completion at 19849.80 on 17-10-2023.  
9- Corrective Wave-C of Wave-(ii) of Wave-3 completion at 18837.80 on 26-10-2023 and impulsive Wave-(iii) of Wave-3 beginning. 
10- Impulsive Wave-(iii) of Wave-3 continuation with its recent high and new life time top formations at 22794.70 on 03-05-2024.

Conclusions from EOD chart analysis
(Waves structure)

Impulsive Wave-1 of new Waves structure begun from 15183.40 on 17-06-2022 after Corrective Wave-C of "ABC correction" of completion at his level. Corrective Wave-2 begun from this level which completed at 16828.30 on 20-03-2023. Impulsive Wave-3 started from this level,of which Wave-(iii) is in continuation with its recent high and new life time top formations at 22794.70 on 03-05-2024 as well as no confirmation of its competion yet on EOD charts..

Nifty-EOD Chart Analysis
(Stochastic & MACD)
Nifty-EOD Chart (03-May-2024):-
Technical Patterns and Formations in EOD charts

1- Rising Channel Pattern formations and Nifty is moving within it
2- Stochastic- %K(5) line has intersected %D(3) line downward and its both lines are falling towards Over sold zone.
3- Stochastic:- %K(5)- 54.34 & %D(3)- 67.20.
4- Stochastic is showing negative divergence.
5- In MACD-its both lines are kissing in Positive zone.
6- MACD(26,12)- 61.44 & EXP(9)- 30.42 & Divergence- 31.02
7- MACD is showing negative divergence.

Conclusions from EOD chart analysis
(Stochastic & MACD)

Impulsive Wave-(iii) of Wave-3 is in continuation with Rising Channel Pattern formations on EOD Charts which started to develop 3 months before and since then Nifty moved most time within its both  upper and lower rising lines,let valid break out/down of its any side line happen then that side next big moves will be seen. Technical positions of Short Term indicators are as follows:-

1- As in Stochastic indicator its %K(5) line has intersected %D(3) line downward and its both lines are falling towards Over sold zone and Stochastic is showing negative divergence also therefore decisive downward moves are expected in the coming week.
3- As in MACD indicator its both lines are kissing in Positive zone therefore it will be understood that now it is not showing any side Trend formation signal. Let any side clear intersection happen then that side decisive moves will be seen after that side Trend formations but MACD is showing negative divergence also therefore finally decisive downward moves are expected in the coming week/weeks.

Nifty-EOD Chart Analysis
(Averages)
Nifty-EOD Chart (03-May-2024):-
Technical Patterns and Formations in EOD charts

Averages:-

1- 5-Day SMA is today at 22558 
2- 21-Day SMA is today at 22453
3- 55-Day SMA is today at 22250
4- 100-Day SMA is today at 21929
5- 200-Day SMA is today at 20782

Conclusions from EOD chart analysis
(Averages)

As Nifty is well above Long and Intermediate Term Trend deciders 200-Day SMA and 55-Day SMA respectively therefore these 2 Trends are up but Short Term Trend is at stake because Nifty is hovering around its deciders 5-Day SMA and 21-Day SMA for the last few sessions.

Nifty-Intra Day Chart Analysis
(03-May-2024)
Nifty-Intra Day Chart (03-May-2024):-
Technical Patterns formation in today intraday charts

1- Selling between 22759-22794
2- Down moves with upward corrections
3- Supports in the last 2 hours between 22349-22494
4- Whole day actual trading between 22349-22794

Conclusions from intra day chart analysis 

Although gap up strong opening last Friday but immediately selling developed and down moves started as well as Nifty moved into negative zone after loosing all intradaalso y gains. As down moves were with upward corrections in Mid-session therefore follow up selling will be understood. Lower levels supports developed in the last 2 hours between 22349-22494 therefore Nifty will firstly trade and prepare for next decisive moves within and near about this range in the beginning of next week. As finally sustaining beyond this supports range will confirm next decisive moves beginning hence it should be firstly watched in the coming week for next decisive moves beginning confirmations.

Conclusions
(After putting all studies together)

1- Long Term trend is up.
2- Intermediate Term trend is up.
3- Short Term Trend is at stake.

Impulsive Wave-(iii) of Wave-3 continuation with its recent high and new life time top formations at 22794.70 in previous session and no confirmation of its completion yet on EOD charts. As Short Term indicator Stochastic is showing more downward moves signals and intraday chart of previous session is also showing higher levels good selling therefore more down moves are expected in the beginning of next week.

As "Rising Channel Pattern" formations on EOD Charts is being seen for the last more than 3 months therefore it is confirm that once valid break out/down of its line any side will mean that side bigger moves beginning confirmations. Although new life time top formations last Friday but both Short Term indicators Stochastic and MACD are showing negative divergence since longer period therefore deeper correction beginning possibility can not be ruled out. Let valid break down of lower Rising line of "Rising Channel Pattern" then deeper correction beginning will get confirmations therefore following next supports should be watched one by one in the coming week/weeks:-

1- 22349-22494
2- 22261-22349
3- 22199-22258
4- 21886-22027
5- 21795-21860
6- 21711-21791
7- 21653-21690
8- 21544-21628

Resistances above previous session closing is as follows:-

1- 22753-22794
2- 22733-22783
3- 22674-22702
4- 22578-22609
5- 22516-22552