ॐ ह्रीं श्रीं लक्ष्मीभयो नमः॥


 This is the "Oldest & Only Website" of whole World
which is updating Nifty & Indian Stock Markets
"Daily and Weekly accurate Outlooks" 
with "Intraday Charts Analysis"for the 
last more than "14 years" means from "2010"
For its live Proofs just see "Archive"
in the "bottom of this Website".

Trading "calls" from our "Software" with more than "90% accuracy"

Live Proofs of our 100% Accurate Predictions of  next target above 6111.80  

Although new top formations at 6114.55 today but we predicted well before its happening on:-

1- 21-04-2013 
2- 31-03-2013 
3- Today at 06:51 AM

Just click following links and verify this fact on yours own:

Following topic was posted on 21-04-2013:-

Wave 5 confirmations for new top of rally above 6111.80

Following topic was posted on 31-03-2013:-

Wave 5 formation towards next target above 6111.80

Following line was told today at 06:51:00 AM in Technical Analysis and Market Outlook(11-05-2013):-

Green zone trading will be seen in today short special session and new top above 6111.80 is also possible 

Technical Analysis and Market Outlook(11-05-2013)

Nifty-Intra Day Chart (10-May-2013):-
Just click on chart for its enlarged view
Technical Patterns and Formations in today intraday charts

1- Selling between 6060-6075
2- Selling between 6047-6057
3- Mixed Patterns between 6079-6105
4- Whole day actual trading between 6047-6105

Conclusions from intra day chart analysis 

Although good selling at lower levels but Indian markets moved up because European markets moved up sharply after sudden sharp rise in US Futures as well as positive news of IIP numbers improvement. Closing near the top of the day after almost last 3 hours trading at intraday higher levels with mixed Pattern formations.

As sentiment is strong after more than 600 points rally in 20 sessions therefore closing near higher levels despite lower levels selling yesterday but sustaining with fresh consolidation at higher levels is must for next decisive rally continuation otherwise correction is very much due because selling patterns seen in previous sessions also.  

All trends are up but indicators have started to show negative divergence in Overbought zone as well as emergence of selling patterns in intraday charts therefore correction is very much due now. As markets moves rolling on slowly in last legs of rally therefore without force up moves are being seen in previous sessions.

As sentiment is good today after US and European markets positive closing yesterday therefore Green zone trading will be seen in today short special session and new top above 6111.80 is also possible but it should be kept in mind that Short Term Correction is very much due and may begin any day.  

FII Trading Data in Derivatives Segment on 10-May-2013


FII & DII trading activity in Capital Market Segment on 10-May-2013

FII trading activity on NSE and BSE in Capital Market Segment(In Rs. Crores)
CategoryDateBuy ValueSell ValueNet Value
FII 10-May-2013 2395.671851.56544.11

DII trading activity on NSE and BSE in Capital Market Segment(In Rs. Crores)
CategoryDateBuy ValueSell ValueNet Value
DII 10-May-2013 755.871258.19-502.32

Indian Stock Markets Closing Reports(10-May-2013)

Main features of today trading are as follows

Ratios

Index Options Put Call Ratio: 1.01
Total Options Put Call Ratio: 0.97
Nifty P/E Ratio(10-May-2013): 18.07

Advances & Declines

BSE Advances : 1,199
BSE Declines : 1,233
NSE Advances :   700
NSE Declines :   712

Nifty Open Interest Changed Today

Nifty- 5800  CE(May)- -33,050(-1.53%)
Nifty- 5800  PE(May)- -135,850(-1.49%)

Nifty- 5900  CE(May)- -519,600(-14.58%)
Nifty- 5900  PE(May)-  218,500(3.08%)

Nifty- 6000  CE(May)- -308,650(-6.12%)
Nifty- 6000  PE(May)-  335,000(5.62%)

Nifty- 6100  CE(May)-  222,550(4.20%)
Nifty- 6100  PE(May)-  1,108,250(56.63%)

Nifty- 6200  CE(May)-  1,171,400(17.10%)
Nifty- 6200  PE(May)-  183,600(25.31%)

Closing 

Sensex- closed at 20,082.62(143.58 Points & 0.72%)
Nifty- closed at 6,094.75(44.60 Points & 0.74%)
CNX Midcap - closed at 8,009.45(25.65 Points & 0.32%)
CNX Smallcap- closed at 3,070.15(21.15 Points & 0.69%)

Nifty Spot-Levels & Trading Strategy for 13-05-2013


Nifty Spot-Levels

R3 6201
R2 6157
R1 6132
Avg 6088
S1 6063
S2 6019
S3 5994

Nifty Spot-Trading Strategy

H6 6176     Trgt 2
H5 6160     Trgt 1
H4 6144     Long breakout
H3 6125     Go Short
H2 6119
H1 6113
L1 6100
L2 6094
L3 6088     Long
L4 6069     Short Breakout
L5 6053     Trgt 1
L6 6037     Trgt 2

Nifty(May Fut)-Levels & Trading Strategy for 13-05-2013


Nifty(May Fut)-Levels

R3 6233
R2 6181
R1 6149
Avg 6097
S1 6065
S2 6013
S3 5981

Nifty(May Fut)-Trading Strategy

H6 6203     Trgt 2
H5 6183     Trgt 1
H4 6164     Long breakout
H3 6141     Go Short
H2 6133
H1 6125
L1 6110
L2 6102
L3 6094     Long
L4 6071     Short Breakout
L5 6052     Trgt 1
L6 6032     Trgt 2

Bank Nifty(May Fut)-Levels & Trading Strategy for 13-05-2013


Bank Nifty(May Fut)-Levels

R3 13133
R2 12961
R1 12855
Avg 12683
S1 12577
S2 12405
S3 12299

Bank Nifty(May Fut)-Trading Strategy

H6 13032     Trgt 2
H5 12967     Trgt 1
H4 12901     Long breakout
H3 12825     Go Short
H2 12799
H1 12774
L1 12723
L2 12698
L3 12672     Long
L4 12596     Short Breakout
L5 12530     Trgt 1
L6 12465     Trgt 2

Mid-session Outlook(10-05-2013)

Nifty was trading at 6050 at 12:30 PM but moved sharply immediately after strong opening of European markets  and today up moves were fuelled by strong up moves in US Futures also. As IIP numbers also improved therefore strong rally seen after its announcements. Now trading near the top of last resistance range(6050-6105) of on going rally. As today up moves are completely news based therefore finally sustaining above 6105 should be watched for strong rally above 6111.

Correcion on cards


Nifty-Intra Day Chart (09-May-2013):-
Just click on chart for its enlarged view
Technical Patterns and Formations in today intraday charts

1- Selling between 6070-6082 
2- Whole day actual trading between 6040-6082

Conclusions from intra day chart analysis 

All trends are up and impulsive Wave-5 continuation but Indicators are overbought and suggesting for correction. Although complete selling patterns on daily charts are required for any deeper correction but Short Term correction is very much possible after any day higher levels intraday selling. As intraday selling patterns formations yesterday therefore minimum Short Term correction will be seen today.

Support were seen between 6024-6040 on 08-05-2013 and expected that Nifty will firstly trade within this range today. As higher levels selling yesterday therefore firstly sustaining beyond 6024 should be watched today for range bound correction between 6024-6083 or little deeper correction toward 5985.

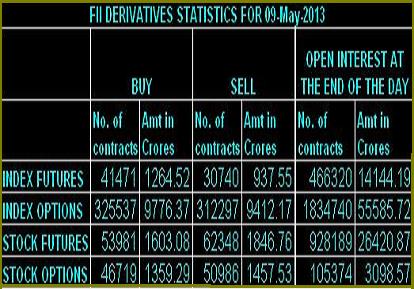
FII Trading Data in Derivatives Segment on 09-May-2013


FII & DII trading activity in Capital Market Segment on 09-May-2013

FII trading activity on NSE and BSE in Capital Market Segment(In Rs. Crores)
CategoryDateBuy ValueSell ValueNet Value
FII 09-May-2013 2249.431586.55662.88

DII trading activity on NSE and BSE in Capital Market Segment(In Rs. Crores)
CategoryDateBuy ValueSell ValueNet Value
DII 09-May-2013 736.231212.92-476.69

Indian Stock Markets Closing Reports(09-May-2013)

Main features of today trading are as follows

Ratios

Index Options Put Call Ratio:  1.17
Total Options Put Call Ratio:  1.09
Nifty P/E Ratio(09-May-2013): 18.00

Advances & Declines

BSE Advances : 1,084
BSE Declines : 1,319
NSE Advances :   596
NSE Declines :   829

Nifty Open Interest Changed Today

Nifty- 5700  CE(May)- -14,100(-0.85%)
Nifty- 5700  PE(May)-  675,450(8.71%)

Nifty- 5800  CE(May)- -23,350(-1.07%)
Nifty- 5800  PE(May)-  326,450(3.71%)

Nifty- 5900  CE(May)- -293,350(-7.61%)
Nifty- 5900  PE(May)-  76,800(1.09%)

Nifty- 6000  CE(May)-  69,500(1.40%)
Nifty- 6000  PE(May)-  237,000(4.14%)

Nifty- 6100  CE(May)- 95,050(1.83%)
Nifty- 6100  PE(May)- 294,700(%)

Nifty- 6200  CE(May)- 610,350(9.78%)
Nifty- 6200  PE(May)- -10,850(-1.47%)

Closing 

Sensex- closed at 19,939.04(-51.14 Points & -0.26%)
Nifty- closed at 6,050.15(-19.15 Points & -0.32%)
CNX Midcap - closed at 7,983.80(-58.35 Points & -0.73%)
CNX Smallcap- closed at 3,338.20(-8.85 Points & -0.26%)

Nifty Spot-Levels & Trading Strategy for 10-05-2013

Nifty Spot-Levels

R3 6120
R2 6102
R1 6076
Avg 6058
S1 6032
S2 6014
S3 5988

Nifty Spot-Trading Strategy

H6 6094     Trgt 2
H5 6084     Trgt 1
H4 6074     Long breakout
H3 6062     Go Short
H2 6058
H1 6054
L1 6045
L2 6041
L3 6037     Long
L4 6025     Short Breakout
L5 6015     Trgt 1
L6 6005     Trgt 2

Nifty(May Fut)-Levels & Trading Strategy for 10-05-2013

Nifty(May Fut)-Levels

R3 6131
R2 6110
R1 6079
Avg 6058
S1 6027
S2 6006
S3 5975

Nifty(May Fut)-Trading Strategy

H6 6094     Trgt 2
H5 6084     Trgt 1
H4 6074     Long breakout
H3 6062     Go Short
H2 6058
H1 6054
L1 6045
L2 6041
L3 6037     Long
L4 6025     Short Breakout
L5 6015     Trgt 1
L6 6005     Trgt 2

Bank Nifty(May Fut)-Levels & Trading Strategy for 10-05-2013

Bank Nifty(May Fut)-Levels

R3 12841
R2 12761
R1 12645
Avg 12565
S1 12449
S2 12369
S3 12253

Bank Nifty(May Fut)-Trading Strategy

H6 12725     Trgt 2
H5 12681     Trgt 1
H4 12636     Long breakout
H3 12582     Go Short
H2 12564
H1 12546
L1 12511
L2 12493
L3 12475     Long
L4 12421     Short Breakout
L5 12376     Trgt 1
L6 12332     Trgt 2

Pre-Closing Outlook(09-05-2013)

Although Last Traded Price of Nifty was at the highest of the day(6083) yesterday but we were not Bullish because intraday showed selling patterns indications between 6050-6065 in last more than 2 hours yesterday. We clearly told the condition of sustaining above 6083 in both previous Outlooks.

As was suspected same happened and Nifty traded whole day below 6083 today with intraday selling patterns at higher levels therefore Short Term Correction is expected now.

Post-open Outlook(09-05-2013)

As selling patterns indications at higher levels seen in last more than 2 hours yesterday therefore following line was told today at 01:13 AM in Technical Analysis and Market Outlook(09-05-2013)

1- selling patterns indications at higher levels seen in last more than 2 hours
2- sustaining above yesterday high(6083) should be firstly watched today for immediate next up moves confirmations.

Selling indications between 6050-6065 yesterday and Nifty traded most time between this range today. Follow up moves between this range will give first indication of next immediate moves and its valid break out should be firstly watched today.

Technical Analysis and Market Outlook(09-05-2013)

Nifty-Intra Day Chart (08-May-2013):-
Just click on chart for its enlarged view
Technical Patterns and Formations in today intraday charts

1- Support between 6024-6040
2- Selling indications 6050-6065
3- Whole day actual trading between 6024-6083

Conclusions from intra day chart analysis 

All trends are up and impulsive Wave-5 continuation but Indicators are overbought and suggesting for correction. As complete selling patterns on daily charts are required for any deeper correction and no such patterns formations yet therefore any deeper correction will not be considered at this moment. Many times Bullish markets complete its corrections between sideways moves or at higher levels consolidations therefore such type of corrections should be kept in mind.

Lower levels supports and selling patterns indications at higher levels seen in last more than 2 hours therefore mixed patterns formations on 08-05-2013. Next strong resistance are between 6050-6105 and complete consolidations patterns are required for crossing and sustaining above 6105 but Nifty traded between this range with selling patterns indications therefore sustaining above yesterday high(6083) should be firstly watched today for immediate next up moves confirmations.

As complete selling patterns are required for any deeper correction and no such formation seen yet therefore rally continuation is expected after follow up consolidations within mentioned resistance range.

FII Trading Data in Derivatives Segment on 08-May-2013


FII & DII trading activity in Capital Market Segment on 08-May-2013

FII trading activity on NSE and BSE in Capital Market Segment(In Rs. Crores)
CategoryDateBuy ValueSell ValueNet Value
FII 08-May-2013 3036.882059.89976.99

DII trading activity on NSE and BSE in Capital Market Segment(In Rs. Crores)
CategoryDateBuy ValueSell ValueNet Value
DII 08-May-2013 782.241451.32-669.08