ॐ ह्रीं श्रीं लक्ष्मीभयो नमः॥


Trading "calls" from our "Software" with more than "90% accuracy"

 This is the "Oldest & Only Website" of whole World
which is updating Nifty & Indian Stock Markets
"Daily and Weekly accurate Outlooks" 
with "Intraday Charts Analysis"for the 
last more than "14 years" means from "2010"
For its live Proofs just see "Archive"
in the "bottom of this Website".
Nifty will celebrate more than 150 
seats BJP victory expectations in 
Gujarat polls through rally above 
life time highest
Technical Analysis,Research & Weekly 
Outlook(Nov 28 to Dec 02,2022)
Nifty-EOD Chart Analysis
(Waves structure)
Nifty-EOD Chart (25-Nov-2022):-
Technical Patterns and Formations in EOD charts

1- Corrective Wave-C completion and Impulsive Wave-1 beginning from 7511.10 on 24-03-2020.
2- Impulsive Wave-1 completion at 11794.30 on 31-08-2020.  
3- Corrective Wave-2 completion at 10790.20 on 24-09-2020.
4- Impulsive Wave-3 completion at 15431.8 on 16-02-2021.
5- Corrective Wave-4 completion at 14151.4 on 22-04-2021.
6- Impulsive Wave-5 completion after new life time top formation at 18604.50 on 19-10-2021 and corrective Wave-A of "ABC" correction beginning with Double Zig-Zag pattern formation. 
7- Wave-A completion at 16410.20 on 20-12-2021.
8- Wave-B completion at 18351.00 on 18-01-2022.
9- Wave-C bottom formation at 15671.5 on 08-03-2022.
10- Wave-X completion at 18114.70 on 04-04-2022.
11- Wave-A completion at 15735.80 on 12-05-2021.
12- Wave-B completion at 16793.80 on 03-06-2022.
13- Wave-C completion at 15183.4 on 17-06-2022.
14- Wave-X continuation with recent top formation at 18534.90 on 25-11-2022.
15- More than 13 months "ABC" correction continuation with Double Zig-Zag pattern formation

Conclusions from EOD chart analysis
(Waves structure)

Impulsive Wave-1 started from 7511.10 on 24-03-2020 and new Waves structure begun which completed at 18604.50 on 19-10-2021 and "ABC" correction commenced that finally converted into Double Zig-Zag pattern. As this waves structure gained 11093.4 points in almost 21 months and its "ABC" correction corrected 3421.1 points in the last more than 13 months which is 30.84% of its impulsive Waves gains therefore strong signals of Price wise and Time wise correction completion generated within sideways market between 15183.4-18604.50.

Now Wave-X of Double Zig-Zag correction continuation with recent top formation at 18534.90 on 25-11-2022 and no indication of its completion yet on EOD charts. Wave-X has gained 3351.50 points in the last 5 months and remained only 69.6 points shorter from life time top at 18604.50. 

Nifty-EOD Chart Analysis 
(Stochastic & MACD)
Nifty-EOD Chart (25-Nov-2022):-
Technical Patterns and Formations in EOD charts

1- Wave-C completion at 15183.40 on 17-06-2022 and Wave-X beginning.
2- Wave-X continuation with recent top formation at 18534.90 on 25-11-2022.
3- Wave-X gained 3351.50 points in last 5 months. 
4- Stochastic- %K(5) line has intersected %D(3) line upward and its both lines are rising towards Over bought zone.
5- Stochastic:- %K(5)- 76.70 & %D(3)- 54.80.
6- In MACD- MACD line has intersected Average line downward and its both lines are falling in positive zone.
7- MACD(26,12)- 219.05 & EXP(9)- 313.84 & Divergence- -94.79

Conclusions from EOD chart analysis 
(Stochastic & MACD)

Wave-X continuation after gaining  3351.50 points in the last 5 months with recent top formation at 18534.90 on 25-11-2022 and no signal of its completion yet. Positions of Short Term indicators are as follows:-
 
1- In Stochastic indicator %K(5) line has intersected %D(3) line upward and its both lines are rising towards Over bought zone therefore showing signals of more up moves.
2- In MACD its MACD line has intersected Average line downward and its both lines are falling in positive zone therefore showing signals of some more down moves .

Nifty-Intra Day Chart Analysis
(25-Nov-2022)
Nifty-Intra Day Chart (25-Nov-2022):-
Technical Patterns formation in today intraday charts

1- Slipping after positive opening
2- Down moves in Bullish Falling Channels
3- Up moves with downward corrections
4- Whole day actual trading between 18446-18534

Conclusions from intra day 
chart analysis 

Although positive opening but firstly slipping from intraday higher levels last Friday. As lower levls consolidation through  Down moves in Bullish Falling Channels and after that up moves with downward corrections also therefore expected that fresh up moves will be seen in next week above last Friday highest(18534.90).

Conclusions (After putting all studies together)

Bullish Wave-X forcefully continuation and All the trends are up. As no signal of Wave-X completion on EOD and intraday charts therefore its continuation is expected in the coming weak. Short Term indicators are also showing signals of more up moves without deeper correction therefore finally rally will be expected after Short Term corrections completion.

Strong signals of Price wise and Time wise "ABC" correction completion generated in sideways market between 15183.4-18604.50 in the last 13 months after on going Wave-X continuation with 3351.50 points gains in the last 5 months. As Wave-X has remained only 69.6 points shorter from life time top at 18604.50 therefore it may move above it any day in the coming week/weeks and in this manner it will confirm new Waves-structure formation from 15183.40 on 17-06-2022 as well as in that situation Wave-X will be converted into Wave-1 of new Waves-structure   

No immediate resistance above last friday highest and following supports are lying below last Friday lowest which should be watched in the situation of Short Term correction beginning:-

1- 18357-18405
2- 18246-18272
3- 18198-18225 
4- 18134-18163

As strong signals of BJP victory by more than 150 seats in upcoming Gujarat assembly polls and it will impact positively of BJP victory prospects in 2024 Parliamentary elections also therefore Indian Stock markets are most Bullish in whole world hence Nifty will rally above life time highest(18604.50) because BJP victory means speedy economic and industrial growth after most honest and strong Central Government formation in 2024 under Modi ji leadership which is the guarantee of all around Indian strength,growth and prosperity.
Finally rally towards life time highest amid only very Short Term correction possibility
Nifty-Intra Day Chart Analysis & 
Market Outlook(25-11-2022)
Nifty-Intra Day Chart (24-Nov-2022):-
Technical Patterns formation in today intraday charts

1- Up moves after positive opening
2- More than 4 hours consolidation between 18357-18405
3- Sharp up in last half hour
4- Whole day actual trading between 18295-18529

Conclusions from intra day
chart analysis 

As firstly  up moves after positive opening and after that more than 4 hours good intraday consolidation between 18357-18405 therefore Sharp up moves were seen in last half hour. Only consolidation and intraday selling was not seen today therefore up moves continuation is expected in the coming sessions also. 

Very Short indicators have turned Over bought after strong intraday today rally therefore only very Short Term correction towards today consolidation range may be seen but finally rally will be seen towards life time highest(18604.50).
Sustaining beyond 18198-18325 
will confirm next decisive moves
Nifty-Intra Day Chart Analysis & 
Market Outlook(24-11-2022)
Nifty-Intra Day Chart (23-Nov-2022):-
Technical Patterns formation in today intraday charts

1- 73 Points fall after gap up strong opening
2- Up moves in Bearish Rising Channels
3- 64 Points sharp fall in last half hour
4- Whole day actual trading between 18246-18325

Conclusions from intra day chart analysis 

Although firstly gap up strong opening but immediately 73 points fall was seen. As after that more than 4 hours up moves in Bearish Rising Channels therefore 64 points sharp fall in last half hour.    

Intraday good consolidation between 18198-18225 yesterday and higher levels selling developed today therefore Nifty will trade and prepare for next decisive moves between 18198-18325 in the coming sessions and finally sustaining beyond this range will confirm it hence sustaining beyond this range should be watched for its confirmations.
Up moves towards next resistance
Nifty-Intra Day Chart Analysis & 
Market Outlook(23-11-2022)
Nifty-Intra Day Chart (22-Nov-2022):-
Technical Patterns formation in today intraday charts

1- Up moves after positive opening
2- More than 4 hours consolidation between 18198-18225
3- Up moves in last hour
4- Whole day actual trading between 18138-18261

Conclusions from intra day chart analysis 

Although firstly slipping after positive opening but after that up moves were seen and more than 4 hours consolidation between 18198-18225 in Mid-session therefore decisive up moves were seen in last hour. As intraday consolidation patterns formation and selling patterns were not seen therefore up moves are expected towards following next resistances:-

1- 18356-18380 
2- 18382-18442
18134-18188 will confirm next 
one sided big moves
Nifty-Intra Day Chart Analysis & 
Market Outlook(22-11-2022)
Nifty-Intra Day Chart (21-Nov-2022):-
Technical Patterns formation in today intraday charts

1- 158 Points fall in first half hour after weaker opening
2- More than 5 hours sideways trading between 18134-18188
3- Whole day actual trading between 18134-18262

Conclusions from intra day chart analysis 

As all the Asian markets and US markets Futures were trading in Red today morning therefore sentiment was depressed hence 158 Points fall in first half hour after weaker opening. More than 5 hours sideways trading between 18134-18188 and Nifty is preparing for next one sided big moves within this range therefore firstly sustaining it beyond or forceful break out/down of this trading range should be watched tomorrow for its beginning confirmations.
 Fresh rally towards and above life time highest amid only a Short Term correction possibility
Technical Analysis,Research & Weekly 
Outlook(Nov 21 to Nov 25,2022)
Nifty-EOD Chart Analysis
(Corrective Waves)
Nifty-EOD Chart (18-Nov-2022):-
Technical Patterns and Formations in EOD charts

1- Impulsive Wave-5 completion after new life time top formation at 18604.50 on 19-10-2021 and corrective Wave-A of "ABC" correction beginning with Double Zig-Zag pattern formation. 
2- Wave-A completion at 16410.20 on 20-12-2021.
3- Wave-B completion at 18351.00 on 18-01-2022.
4- Wave-C bottom formation at 15671.5 on 08-03-2022.
5- Wave-X completion at 18114.70 on 04-04-2022.
6- Wave-A completion at 15735.80 on 12-05-2021.
7- Wave-B completion at 16793.80 on 03-06-2022.
8- Wave-C completion at 15183.4 on 17-06-2022.
9- Wave-X continuation with recent top formation at 18442.20 on 16-11-2022.
10- 13 Months "ABC" correction continuation with Double Zig-Zag pattern formation between 15183.4-18604.50.

Conclusions from EOD chart analysis
(Corrective Waves)

"ABC" correction begun with Double Zig-Zag pattern formation after new life time top formation at 18604.50 on 19-10-2021 and in continuation for the last 13 months with its lowest formations at 15183.4 on 17-06-2022. Then Wave-X started and still in continuation with recent top formation at 18442.20 on 16-11-2022 as well as no confirmation of its completion yet on EOD and intraday charts.  

Nifty-EOD Chart Analysis
(Stochastic & MACD)
Nifty-EOD Chart (18-Nov-2022):-
Technical Patterns and Formations in EOD charts

1- Wave-X continuation with recent top formation at 18442.20 on 16-11-2022.
2- Stochastic- %K(5) line has intersected %D(3) line downward and its both lines are falling from Over bought zone.
3- Stochastic:- %K(5)- 60.50 & %D(3)- 76.33.
4- In MACD- MACD line has intersected Average line downward and its both lines are falling in positive zone.
5- MACD(26,12)- 344.21 & EXP(9)- 409.97 & Divergence- -65.76

Conclusions from EOD chart analysis
(Stochastic & MACD)

Although Wave-X continuation with recent top formation at 18442.20 on 16-11-2022 and no confirmation of its completion yet on EOD and intraday charts but following Short Term indicators are suggesting Short Term correction beginning possibility:-

1- In Stochastic indicator its %K(5) line has intersected %D(3) line downward and its both lines are falling from Over bought zone therefore confirming beginning of Short Term correction.
2- In MACD indicator its MACD line has intersected Average line downward and its both lines are falling in positive zone therefore showing 1st signal of downward trend formation.

Nifty-Last 6 Sessions
 intraday charts analysis
Nifty-Intra Day Chart (Nov 11 to Nov 18,2022):-
Technical Patterns formation in last 6 Sessions intraday charts

1- Selling(Resistances) in last 6 Sessions are as follows:-
A- 18356-18380 
B- 18382-18442
2- Consolidation(Supports) in last 6 Sessions are as follows:-
A- 18282-18306
B- 18210-18272 
3- Last 6 Sessions actual trading between 18210-18442

Conclusions from 6 Sessions
intra day chart analysis 

As last 6 Sessions trading between 18210-18442 with above mentioned resistances and supports which are almost equally stronger also therefore expected that Nifty will firstly trade and prepare for next Short/Intermediate Tem Trend within last 6 sessions trading range and finally sustaining beyond this range will confirm it hence should be watched in the coming week for its confirmations.

Nifty-Intra Day Chart Analysis
(18-Nov-2022)
Nifty-Intra Day Chart (18-Nov-2022):-
Technical Patterns formation in today intraday charts

1- Down moves in Bullish Falling Channel in first 2 hours
2- Consolidation between 18210-18272(immediate supports)
3- Sharp up moves in last half hour
3- Whole day actual trading between 18210-18394

Conclusions from intra day chart analysis 

Although positive opening but not sustaining at intraday higher levels and down moves started. As these first 2 hours down moves were in Bullish Falling Channel and after that lower levels consolidation between 18210-272 therefore sharp up moves were seen in last half hour and these up moves continuation is expected towards next resistances in the beginning of next week also.  

Immediate supports of Nifty are above last Friday lower levels between 18210-18272 and until Nifty will not sustain below 18210 after complete fresh selling till then decisive down moves will not be seen.
 
Conclusions
(After putting all studies together)

1- Long Term Trend is up.
2- Intermediate Term Trend is up.
3- Short Term Trend is sideways between 18210-18442 for the last 6 sessions.

"ABC" correction started after almost 21 months Bullish rally {from 7511.10(24-03-2020) to 18604.50(19-10-2021)}  completion and still in continuation for the last 13 months with its lowest formations at 15183.4 on 17-06-2022. As Nifty has corrected 3421.1 points ie 30.84% of previous Bullish rally(11093.4 points gaining) also therefore strong signals of Price wise and Time wise correction completion in sideways market between 15183.4-18604.50 in the last 13 months.

Now Wave-X continuation after gaining 3258.8 points in 5 months with recent top and new highest of on going "ABC" correction formation at 18442.20 on 16-11-2022 as well as no confirmation of its completion yet on EOD and intraday charts therefore at present its continuation will be considered towards and above life time highest(18604.50). Although Wave-X remained only 162.3 points shorter than life time top(18604.50) but higher levels selling was seen in last 6 sessions and Short Term indicators also are suggesting Short Term correction beginning possibility therefore firstly sustaining beyond above mentioned 2 immediate supports of last 6 sessions trading range(18210-18442) should be watched in the coming week. Next supports below 18210 are as follows which should also be watched if Nifty sustains below 18210 amid finally Wave-X fresh rally beginning towards and above life time highest(18604.50) after expected Short Term correction completion:-

1- 17938-17964
2- 17724-17765 
3- 17655-17712
4- 17477-17591
5- 17381-17401(Gap support)
 18282 will confirm next 
decisive moves
Nifty-Intra Day Chart Analysis & 
 Market Outlook(18-11-2022)
Nifty-Intra Day Chart (17-Nov-2022):-
Technical Patterns formation in today intraday charts


1- Selling between 18382-18417
2- Sharp fall in last half hpur
3- Whole day actual trading between 18313-18417

Conclusions from intra day chart analysis 

Selling was seen between 18405-18442 yesterday and follow nup selling developed within and below it between 18382-18417 therefore sharp fall in last half hpur and today closing was near the lower levels of the day.

As good intraday selling in last 2 sessions therefore expected that down mones will be seen towards the lowest of next strong supports range(18282-18349) and firstly sustaining beyond 18282 should be watched tomorrow for:-

1- Sustaining Below 18282 will will mean Short Term correction beginning after last 5 sessions trading range breaking down confirmations 
2- Sustaining above 18282 will mean firstly up moves towards next resistances between 18382-18442.
Finally 18282-18442 will confirm next Short/Intermediate Term Trend
Nifty-Intra Day Chart Analysis & 
Market Outlook(17-11-2022)
Nifty-Intra Day Chart (16-Nov-2022):-
Technical Patterns formation in today intraday charts

1- Support between 18357-18386
2- Selling between 18405-18442
3- Support between 18345-18383
4- Whole day actual trading between 18345-18442

Conclusions from intra day
chart analysis 

Although new top of the on going rally formation today but higher levels good intraday selling was seen because Russian made missile fall in Poland news led Geo Political tension dominated in all the Global markets and resultant:-

1- All Asian markets except Nikkei 225 closed in Red. 
2- All European markets except FTSE 100 were trading in negative zone during Indian trading hours.

As lower levels intraday supports were also seen today therefore Nifty closed flat today but remain cautious tomorrow because if Geo Political tension mounts then sharp fall may also be seen in all the Global markets. Next 2 supports of Nifty are as follows:-

1- 18345-18386
2- 18282-18349(Strong supports)

Immediate supports and resistances are lying between 18282-18442 and Nifty will firstly trade as well as prepare for next decisive moves within this range. As finally sustaining beyond this range will confirm next Short/Intermediate Term Trend therefore should be firstly watched in the coming 1/2 sessions.
Watch 18282-18349 for next decisive moves confirmation after rising Geo Political tension
Post-open Outlook(16-11-2022)

As Geo Political tension risen after Russian made missile fall in Poland therefore all the US markets Futures including most Asian markets are trading in Red hence resultant Indian markets are also trading in negative zone since opening today.

As good intraday consolidation between 18282-18349 yesterday therefore until Nifty will not sutain below 18282 after complete selling till then decisive down moves will not be seen. Until Geo Political picturewill not be clear till then all the Global stock markets will remain uncertain. As finally next decisive moves of Indian markets be decided through sustaining beyond yesterday consolidation range(18282-18349) therefore should be watched for its confirmations.
 Bullish rally continuation
 towards life time highest
Nifty-Intra Day Chart Analysis & 
Market Outlook(16-11-2022)
Nifty-Intra Day Chart (15-Nov-2022):-
Technical Patterns formation in today intraday charts

1- 93 Points fall in first 36 minutes after positive opening
2- 5 Hours lower levels consolidation between 18282-18349
3- Sharp up in last half hour
4- Whole day actual trading between 18282-18427

Conclusions from intraday
chart analysis 

Although closed in at Red at the lower levels of the day yesterday but we told following lines yesterday in "Up moves towards today highest":-

1- firstly up moves are expected towards today highest
2- Finally sustaining above today highest(18,399.45) should be watched for next decisive up moves towards life time highest(18,604.50)

As was told yesterday 100% same happened today and:- 

1- Firstly Nifty moved up 15 points after positive opening
2- Finally Nifty moved above yesterday highest(18,399.45) and closed also above it at 18,403.40 after forming today highest at 18,427.95.

As lower levels 5 hours good intraday consolidation between 18282-18349 today and higher levels no immediate resistance therefore expected that firstly Bullish rally will remain continued towards life time highest(18,604.50). 

Let complete intraday selling develop then Short Term correction will be considered after sustaining below 18282 because good intraday consolidation was seen above it today.
Up moves towards today highest
Nifty-Intra Day Chart Analysis & 
Market Outlook(15-11-2022)
Nifty-Intra Day Chart (14-Nov-2022):-
Technical Patterns formation in today intraday charts

1- Firstly up moves after gap up opening.
2- 70 Points sharp fall in first hour.
3- Down moves in Bullish Falling Channels.
4- Whole day actual trading between 18312-18399

Conclusions from intra day
chart analysis 

Although firstly up moves after gap up opening but 70 points sharp fall was seen in first hour. As after that intraday consolidation through Down moves in Bullish Falling Channels also therefore firstly up moves are expected towards today highest. Finally sustaining above today highest(18,399.45) should be watched for next decisive up moves towards life time highest(18,604.50).
 Nifty new life time top formation
 under the leadership of Modi ji's
 strongest Indian Government
 in whole world
Technical Analysis,Research & Weekly
 Outlook(Nov 14 to Nov 18,2022)
Nifty-EOD Chart Analysis
(Waves structure)
Nifty-EOD Chart (11-Nov-2022):-
Technical Patterns and Formations in EOD charts

1- Corrective Wave-C completion and Impulsive Wave-1 beginning from 7511.10 on 24-03-2020.
2- Impulsive Wave-1 completion at 11794.30 on 31-08-2020.  
3- Corrective Wave-2 completion at 10790.20 on 24-09-2020.
4- Impulsive Wave-3 completion at 15431.8 on 16-02-2021.
5- Corrective Wave-4 completion at 14151.4 on 22-04-2021.
6- Impulsive Wave-5 completion after new life time top formation at 18604.50 on 19-10-2021 and corrective Wave-A of "ABC" correction beginning with Double Zig-Zag pattern formation. 
7- Wave-A completion at 16410.20 on 20-12-2021.
8- Wave-B completion at 18351.00 on 18-01-2022.
9- Wave-C bottom formation at 15671.5 on 08-03-2022.
10- Wave-X completion at 18114.70 on 04-04-2022.
11- Wave-A completion at 15735.80 on 12-05-2021.
12- Wave-B completion at 16793.80 on 03-06-2022.
13- Wave-C completion at 15183.4 on 17-06-2022.
14- Wave-X continuation with recent top formation at 18362.30 on 11-11-2022.
15- More than 1 year "ABC" correction continuation with Double Zig-Zag pattern formation

Conclusions from EOD chart analysis
(Waves structure)

A new structure started from 7511.10 on 24-03-2020 through its Impulsive Wave-1 which was completed after its impulsive Wave-5 life time top formation at 18604.50 on 19-10-2021. On going Waves structure gained 11093.4 points in almost 21 months and after this "ABC" correction with Double Zig-Zag pattern formation begun which is in continuation for the last more than 12 months after correcting 30.84%,loosing 3421.1 points and bottom formation at 15183.4 on 17-06-2022. It means that there are strong signals of Price wise and Time wise correction completion in sideways market between 15183.4-18604.50.

Now Wave-X continuation with recent top formation at 18362.30 on 11-11-2022 which is above previous highest(18351.00 on 18-01-20220) of on going "ABC" correction. Wave-X has gained 3178.9 points in the last more than 4 months and remained only 242.2 points shorter than previous life time top at 18604.50 as well as on EOD charts no indication of Wave-X Bullish rally completion. 

Nifty-EOD Chart Analysis
(Stochastic & MACD)
Nifty-EOD Chart (11-Nov-2022):-
Technical Patterns and Formations in EOD charts

1- Wave-X continuation with recent top formation at 18362.30 on 11-11-2022.
2- Stochastic- %K(5) line has intersected %D(3) line downward and its both lines are falling below Over bought zone.
3- Stochastic:- %K(5)- 58.64 & %D(3)- 61.78.
4- Stochastic is showing negative divergence.
5- In MACD- MACD line has intersected Average line upward and its both lines are rising in positive zone.
6- MACD(26,12)- 445.35 & EXP(9)- 410.22 & Divergence- 35.13

Conclusions from EOD chart analysis
(Stochastic & MACD)

Although Wave-X forcefully continuation but Short Term Indicators are showing Short Term correction beginning signals in following manner:-

1- In Stochastic indicator %K(5) line has intersected %D(3) line downward and its both lines are falling below Over bought zone as well as this indicator is clearly showing negative divergence therefore strongly suggesting that Short Term Correction is on cards which may start any day in the coming week/weeks.
2- In MACD its MACD line has intersected Average line upward and its both lines are rising in positive zone also but its MACD line has almost flattened and Divergence between both lines has been narrowed down to only 35.13 therefore showing first signal of Short Term Correction beginning.

Nifty-Intra Day Chart Analysis
(11-Nov-2022)
Nifty-Intra Day Chart (11-Nov-2022):-
Technical Patterns formation in today intraday charts

1- Consolidation between 18279-18327 
2- Up moves with downward corrections
3- Whole day actual trading between 18260-18362

Conclusions from intra day 
chart analysis 

AS firstly huge gap up opening and after that consolidation between 18279-18327 as well as last 3 hours up moves with downward corrections therefore whole day good intraday consolidation will be understood and on going rally continuation will be expected above last Friday highest(18362). Let Nifty to sustain above it in the beginning of next week then decisive up moves will be seen towards/above life time highest(18604.50) in the coming week/weeks.

Conclusions
(After putting all studies together)

All the trends are up. Wave-X continuation with recent top and new highest of on going "ABC" correction formation at 18362.30 on 11-11-2022 as well as no indication of its completion yet on EOD and intraday charts.

As sentiment is too much heated and Short Term indicators are also suggesting high possibility of Short Term Correction beginning therefore following next supports should also be firstly watched after correction starting confirmations:-

1- 18279-18327
2- 17970-18012 
3- 17938-17964
4- 17724-17765 
5- 17655-17712

As Indian economy has shown extreme strength under the leadership of Modi ji's strongest Indian Government in whole world during and after Covid-19 period therefore Indian Stock markets out performed all the Global Stock markets hence sharp rally will be seen after Nifty new life time top formation above 18604.50. Once Nifty moving above 18604.50 will mean:-

1- New Wave structure beginning.
2- Wave-X converting into Wave-1 of new Wave structure. 
3- Wave-1 of new Wave structure beginning will be understood from 15183.4 on 17-06-2022.
 Up moves expectations above
 today highest
Nifty-Intra Day Chart Analysis & 
Market Outlook(11-11-2022)
Nifty-Intra Day Chart (10-Nov-2022):-
Technical Patterns formation in today intraday charts

1- 145 Points fall in first 40 minutes after gap down opening
2- Up moves with downward corrections
3- Down moves in Bullish Falling Channel
4- Consolidation between 17970-18012 
5- Minor up moves in last half hour
6- Whole day actual trading between 17970-18103

Conclusions from intra day 
chart analysis 

Although firstly 145 points fall in first 40 minutes after gap down opening and Nifty closed Nifty closed 0.71% down also but after that consolidation was seen at lower levels and other 2 consolidation patterns also developed therefore minor up moves were seen in last half hour. 

As good intraday consolidation patterns formations today therefore up moves are expected above today highest(18103) in the coming sessions.
 Down moves towards next supports
Nifty-Intra Day Chart Analysis 
& Market Outlook(10-11-2022)
Nifty-Intra Day Chart (09-Nov-2022):-
Technical Patterns formation in today intraday charts

1- 50 Points fall in first minute after gap up strong opening
2- Down moves with upward corrections
3- Selling between 18166-18214 
4- Volatility in last hour between 18118-18296 
5- Whole day actual trading between 18118-18296

Conclusions from intra day chart analysis 

Although gap up strong opening today but not sustaining at higher levels and 50 points fall was seen in first minute. As after this fall Down moves were with upward corrections and selling between 18166-18214 therefore again sharp fall was seen in last hour. 

Whole day good intraday selling was seen today therefore down moves are expected towards following next supports in the coming sessions:-

1- 17938-17964
2- 17724-17765 
3- 17655-17712
 Sustaining beyond 18065-18255 will confirm next intraday decisive moves
Nifty-Intra Day Chart Analysis &
 Market Outlook(09-11-2022)
Nifty-Intra Day Chart (07-Nov-2022):-
Technical Patterns formation in today intraday charts

1- Firstly 135 down moves in first 2 hours down moves with upward corrections
2- Selling between 18100-18158
3- Sharp fall
4- Up moves with downward corrections
5- Whole day actual trading between 18065-18255

Conclusions from intra 
day chart analysis 

Although firstly 135 down moves in first 2 hours but were with upward corrections and after that selling between 18100-18158 also therefore sharp fall was seen in after 01:00 PM.  As last 2 hours up moves were with downward corrections also therefore last Monday intraday trading will be understood with both consolidation and selling patterns formations between 18065-18255 and firstly sustaining it beyond should be watched tomorrow for next intraday decisive moves beginning confirmations.
Sustaining beyond last 5 sessions trading range will confirm next Short to Long Term Trend
Technical Analysis,Research & Weekly Outlook
(Nov 07 to Nov 11,2022)
Nifty-EOD Chart Analysis
(Corrective Waves)
Nifty-EOD Chart (04-Nov-2022):-
Technical Patterns and Formations in EOD charts

1- Impulsive Wave-5 completion after new life time top formation at 18604.50 on 19-10-2021 and corrective Wave-A of "ABC" correction beginning with Double Zig-Zag pattern formation. 
2- Wave-A completion at 16410.20 on 20-12-2021.
3- Wave-B completion at 18351.00 on 18-01-2022.
4- Wave-C bottom formation at 15671.5 on 08-03-2022.
5- Wave-X completion at 18114.70 on 04-04-2022.
6- Wave-A completion at 15735.80 on 12-05-2021.
7- Wave-B completion at 16793.80 on 03-06-2022.
8- Wave-C completion at 15183.4 on 17-06-2022.
9- Wave-X continuation with recent top formation at 18178.80 on 02-11-2022.

Conclusions from EOD chart analysis
(Corrective Waves)

Corrective Wave-A of "ABC" correction started after impulsive Wave-5 completion with new life time top formation at 18604.50 on 19-10-2021. Finally "ABC" correction has corrected with Double Zig-Zag pattern formation between 15183.4-18604.50 for the last more than 12 months.

Now Wave-X of Double Zig-Zag correction continuation with recent top formation at  at 18178.80 on 02-11-2022 and no confirmation of its completion yet on EOD and intraday charts.

Nifty-EOD Chart Analysis
(Stochastic & MACD)
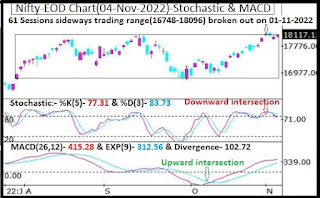
Nifty-EOD Chart (04-Nov-2022):-
Technical Patterns and Formations in EOD charts

1- 61 Sessions sideways trading range(16748-18096) broken out on 01-11-2022.
2- Wave-X continuation with recent top formation at 18178.80 on 02-11-2022.
3- Stochastic- %K(5) line has intersected %D(3) line downward and its both lines are falling nearabout Over bought zone.
4- Stochastic:- %K(5)- 77.31 & %D(3)- 83.73.
5- In MACD- MACD line has intersected Average line upward and its both lines are rising in positive zone.
6- MACD(26,12)- 415.28 & EXP(9)- 312.56 & Divergence- 102.72

Conclusions from EOD chart analysis
(Stochastic & MACD)

Nifty traded sideways 61 sessions between 16748-18096 and this 61 sessions like big trading range was broken out on 01-11-2022 and on going Wave-X of Double Zig-Zag pattern is in continuation with recent top formation at 18178.80 on 02-11-2022 as well as no confirmation off its completion yet on EOD and intraday charts. 

Let Nifty to sustain above last 61 sessions trading range highest(18096) in the coming week/weeks then up moves will be seen towards life time highest at 18604.50 and then possibility of strong rally above it also can not be ruled out. Positions of Short Term indicators are as follows:-

1- In Stochastic indicator %K(5) line has intersected %D(3) line downward and its both lines are falling near about Over bought zone therefore showing high possibility of Short Term Correction beginning from any day of next week
2- In MACD its MACD line has intersected Average line upward and its both lines are rising in positive zone therefore confirming upward trend formations

Final conclusion from both the above indicators is that up moves will restart after Short Term correction completion but correction should not be deeper because divergence in MACD is only 102.72 and in the situation of deeper correction MACD line will intersect Average line downward and then will start to generate downward trend formation signals.

Nifty-Intra Day Chart Analysis
(04-Nov-2022)
Nifty-Intra Day Chart (04-Nov-2022):-
Technical Patterns formation in today intraday charts

1- Down moves in first 2 hours after flat opening
2- 4 Hours consolidation between 18018-18078
3- Sharp up moves in last half hour
4- Whole day actual trading between 18018-18135

Conclusions from intra day chart analysis 

Although firstly down moves in first 2 hours after flat opening but after that lower levels 4 Hours good consolidation was seen between 18018-18078 therefore Sharp up moves developed in last half hour and last Friday started up moves continuation is expected towards next resistances between 18121-18175 in the beginning of next week also.

Conclusions
(After putting all studies together)

All the trends are up and 61 sessions like big trading range(16748-18096) has been broken out in previous week but confirmation of sustaining above 18096 is still required. Let Nifty to sustain above 18096 then strong rally will be seen towards life time highest(18604.50) and above it also. 

Immediate resistances above 18096 are as follows:-

1- 18121-18175
2- 18230-18314 
3- 18379-18458
4- 18548-18604

Immediate supports below last Friday closing(18,117.15) are as follows:-

1- 17938-17964
2- 17724-17765 
3- 17655-17712
4- 17477-17591
5- 17381-17401(Gap support)
6- 17226-17374
7- 17106-17219
8- 16941-17029
9- 16760-16855

Now Wave-X continuation with recent top formation at 18178.80 on 02-11-2022 with above mentioned resistances. As no confirmation of its completion yet on EOD and intraday charts therefore firstly sustaining beyond last 5 sessions trading range(17900-18082) should be watched in the coming week/weeks for next Short to Long Term Trend beginning confirmations.
 Down moves expectations 
towards today lowest
Nifty-Intra Day Chart Analysis & 
Market Outlook(04-11-2022)
Nifty-Intra Day Chart (03-Nov-2022):-
Technical Patterns formation in today intraday charts

1- 70 Points recovery from lower levels in first 4 minutes after gap down weaker opening
2- Selling between 18045-18106
3- Selling between 18025-18067
4- Whole day actual trading between 17960-18106

Conclusions from intra day chart analysis 

Although firstly gap down opening but 70 points recovery from lower levels in first 4 minutes and Nifty traded in positive zone also. As firstly more than 2 hours selling between 18045-18106 and after that follow up selling in last 2 hours also between 18025-18067 therefore firstly down moves are expected towards today lowest(17959.20) which is within yesterday mentioned 1st supports between 17938-17964.
 Down moves expectations 
towards next supports
Nifty-Intra Day Chart Analysis & 
Market Outlook(03-11-2022)
Nifty-Intra Day Chart (02-Nov-2022):-
Technical Patterns formation in today intraday charts

1- 50 Points fall in first minute after positive opening
2- More than 5 hours down moves with upward corrections
3- Whole day actual trading between 18049-18178

Conclusions from intra day chart analysis 

Although positive opening but 50 Points fall in first minute and after that more than 5 hours down moves with upward corrections and consolidation patterns were not seen therefore down moves are expected towards following next supports:-


1- 17938-17964
2- 17724-17765 
 Short Term correction expectations
Nifty-Intra Day Chart Analysis & 
Market Outlook(02-11-2022)
Nifty-Intra Day Chart (01-Nov-2022):-
Technical Patterns formation in today intraday charts

1- Up moves after gap up strong opening
2- Selling between 18121-18175
3- Selling between 18104-18155
4- Whole day actual trading between 18061-18175

Conclusions from intra day chart analysis 

Anthough firstly up moves after gap up strong opening but selling was seen in 3 hours and after that follow up selling also developed in last 2 hours therefore Short Term correction is expected below today lowest(18060.15)
 Sustaining above last resistances will
 confirm fresh strong rally beginning
Nifty-Intra Day Chart Analysis & 
Market Outlook(01-11-2022)
Nifty-Intra Day Chart (31-Oct-2022):-
Technical Patterns formation in today intraday charts

1- Up moves after strong opening
2- More than 5 hours sideways trading between 17938-17989
3- Sharp up moves in last half hour
4- Whole day actual trading between 17900-18022

Conclusions from intra day chart analysis 

As firstly up moves after strong opening and after that pure selling was not seen and some consolidation also developed in more than 5 hours sideways trading between 17938-17989 therefore sharp up moves in last half hour and resultant today closing was near the higher levels of the day. 
Last resistances of previous 60 Sessions trading range( 16748-18096) are between  18044-18091 and today highest was just below it at 18022.80 as well as more consolidation is reuqired for next strong rally beginning after sustaining above 18096 therefore it should be firstly watched in the coming sessions for fresh strong rally beginning confirmations.
 Firstly up moves but emergence of Short Term correction possibility also
Technical Analysis,Research & Weekly Outlook
(Oct 31 to Nov 04,2022)
Nifty-EOD Chart Analysis
(Waves structure)
Nifty-EOD Chart (28-Oct-2022):-
Technical Patterns and Formations in EOD charts

1- Corrective Wave-C completion and Impulsive Wave-1 beginning from 7511.10 on 24-03-2020.
2- Impulsive Wave-1 completion at 11794.30 on 31-08-2020.  
3- Corrective Wave-2 completion at 10790.20 on 24-09-2020.
4- Impulsive Wave-3 completion at 15431.8 on 16-02-2021.
5- Corrective Wave-4 completion at 14151.4 on 22-04-2021.
6- Impulsive Wave-5 completion after new life time top formation at 18604.50 on 19-10-2021 and corrective Wave-A of "ABC" correction beginning with Double Zig-Zag pattern formation. 
7- Wave-A completion at 16410.20 on 20-12-2021.
8- Wave-B completion at 18351.00 on 18-01-2022.
9- Wave-C bottom formation at 15671.5 on 08-03-2022.
10- Wave-X completion at 18114.70 on 04-04-2022.
11- Wave-A completion at 15735.80 on 12-05-2021.
12- Wave-B completion at 16793.80 on 03-06-2022.
13- Wave-C completion at 15183.4 on 17-06-2022.
14- Wave-X continuation with recent top formation at 18096.20 on 15-09-2022.
15- More than 1 year "ABC" correction continuation with Double Zig-Zag pattern formation

Conclusions from EOD chart analysis
(Waves structure)

Waves structure which begun from 7511.10 on 24-03-2020 through its Impulsive Wave-1 was completed through its impulsive Wave-5 at 18604.50 on 19-10-2021 after gaining 11093.4 points in almost 21 months and "ABC" correction begins which is in continuation for the last more than 1 year. On going "ABC" correction is with Double Zig-Zag pattern formation which lost 3421.1 points after its bottom formation at 15183.4 on 17-06-2022. It means that Nifty has corrected 30.84% in more than 12 months and showing signals of Price wise and Time wise correction completion of that Bullish rally which gained 11093.4 points in almost 21 months. 

Now Wave-X continuation with recent top formation at 18096.20 on 15-09-2022 and it has gained 2912.8 points during its more than 4 months Bullish journey as well as finally it will decide the life and length of on going "ABC" correction(with Zig-Zag pattern formation) therefore should be watched in the coming weeks/months for its confirmations.

Nifty-EOD Chart Analysis
(Stochastic & MACD)
Nifty-EOD Chart (28-Oct-2022):-
Technical Patterns and Formations in EOD charts

1- Wave-C completion at 15183.4 on 17-06-2022 and Wave-X beginning.
2- Wave-X continuation with recent top formation at 18096.20 on 15-09-2022.
3- Last 60 Sessions sideways correction between 16748-18096.
4- Stochastic- %K(5) line has intersected %D(3) line downward and its both lines are falling from Over bought zone.
5- Stochastic:- %K(5)- 74.93 & %D(3)- 75.95.
6- Stochastic is showing negative divergence
7- In MACD- MACD line has intersected Average line upward and its both lines are rising in positive zone.
8- MACD(26,12)- 310.77 & EXP(9)- 64.22 & Divergence- 246.55

Conclusions from EOD chart analysis
(Stochastic & MACD)

As Wave-X is correcting into sideways mode between 16748-18096 for the last 60 Sessions which is too much long period and finally sustaining beyond or forceful break out/down of this trading range will decide also next one sided big moves therefore firstly it should be watched in the coming weeks/months for its confirmations. Positions of Short Term indicators are as follows:-

1 In Stochastic indicator %K(5) line has intersected %D(3) line downward and its both lines are falling from Over bought zone as well as it is showing negative divergence therefore showing strong sinals of Short Term correction beginning which may start any day in the coming 1/2 weeks,
2-  In MACD its MACD line has intersected Average line upward and its both lines are rising in positive zone therefore showing upward trend and suggesting some more up moves possibilities.

Although both the above Short Term indicators are showing adverse signals but Stochastic is showing stronger indications therefore expected that firstly Short Term correction will be seen and after that up moves will restart after Short Term correction completion.

Nifty-Intra Day Chart Analysis
(28-Oct-2022)
Nifty-Intra Day Chart (28-Oct-2022):-
Technical Patterns formation in today intraday charts

1- Volatility in first 2 hours between 17777-17838
2- Down moves with upward corrections
3- Up moves with downward corrections
4- Whole day actual trading between 17724-17838

Conclusions from intra day chart analysis 

Although firstly Nifty traded more than 100 points up after positive opening but volatility in first 2 hours and after that selling was seen through down moves with upward corrections and Nifty traded in negative zone also. As some up moves with downward corrections in last 2 hours after getting lower levels supports therefore some consolidation will also be understood and firstly up moves are expected towards following next resistances in the beginning of next week:-
1- 17798-17838
2- 17852-17919
3- 18044-18091

Conclusions (After putting
all studies together)

As Nifty has closed above all the Short to Long Term Averages for the last 8 sessions therefore all the Trends are up. 

On going Wave-X has shown too much strength after gaining 2912.8 points in the last more than 4 months rally which remained only 508.3 points short of life time highest(18604.50) after forming it recent top at 18096.20 therefore indications of its new life time top formations have emerged. As Wave-X is moving sideways between 16748-18096 for the last 60 Sessions like big period and Russia-Ukraine war may turn into Atomic World-war also therefore firstly sustaining beyond this range should be watched for the confirmation of:-

1- Above 18096 will confirm fresh strong rally beginning with high possibility of bullish moves after new life time top formations.
2- Below 16748 will mean deeper correction beginning towards and below the bottom(15183.4) of on going "ABC" correction.

Next resistance between 16748-18096 have been posted above and next supports within this range are as follows which may have to be watched in the coming week/weeks because as per Short Term indicator Stochastic Short Term correction is on cards:-

1- 17655-17712
2- 17477-17591
3- 17381-17401(Gap support)
4- 17226-17374
5- 17106-17219
6- 16941-17029
7- 16760-16855