ॐ ह्रीं श्रीं लक्ष्मीभयो नमः॥


Trading "calls" from our "Software" with more than "90% accuracy"

 This is the "Oldest & Only Website" of whole World
which is updating Nifty & Indian Stock Markets
"Daily and Weekly accurate Outlooks" 
with "Intraday Charts Analysis"for the 
last more than "14 years" means from "2010"
For its live Proofs just see "Archive"
in the "bottom of this Website".
Immediate supports will confirm next decisive moves
Intra Day Charts Analysis & Market Outlook
(10-06-2020)
Nifty-Intra Day Chart (Jun 08 & Jun 09,2020)
Just click on chart for its enlarged view
Technical Patterns formation in last 2 Sessions intraday charts

1- Selling between 10276-10328 on 08-06-2020
2- Support between 10121-10184 on 08-06-2020
3- Support between 10150-10176 on 09-06-2020 
4- Selling between 10234-10291 on 09-06-2020  
5- Sharp fall in last hour on 09-06-2020 
6- Support between 10022-10052 on 09-06-2020(Immediate Supports)
7- 2 Sessions actual trading between 10022-10328

Conclusions from 2 Sessions intra day chart analysis 

As selling between 10276-10328 on yesterday and follow up selling was seen within and below this range today therefore Nifty slipped below the lower levels supports of yesterday and today and after that sharp fall developed in last hour today.

Support between 10022-10052 was seen today and once sustaining below it will mean decisive down moves towards next supports between 9945-9984.

Calculation of 2 targets of Nifty(10361 & 10276.32) as follows:-

1- Nifty traded 18 Sessions(May 04 to May 28,2020) within 777 points between 8807-9584 and when this range was broken out on 29-05-2020 then its immediate target was at 10361(9584+777).
2- 61.8% Fibonacci Extension Target of Wave-c of Wave-B was at 10276.32{8806.75+1469.57(61.8% of 2377.95)}(It has been explained with EOD chart in previous topic-"Rally continuation amid only Short Term Correction expectations". 

As last 2 sessions selling just below and near about above mentioned 2 targets therefore complete consolidation is firstly required for on going rally continuation above 10361.

Lower levels immediate support between 10022-10052 today and firstly sustaining it beyond should be watched tomorrow for:-

1- Above 10052 will mean up moves towards 10234
2- Below 10022 will mean down moves towards next supports between 9945-9984
As not feeling well therefore Stock Market Outlook of today(09-06-2020) is not being updated.
Rally continuation amid only Short Term Correction expectations
Technical Analysis,Research & Weekly Outlook
(Jun 08 to Jun 12,2020)
Nifty-EOD Chart Analysis
(Wave-B structure)
Nifty-EOD Chart (05-Jun-2020):-

Technical Patterns and Formations in EOD charts

1- Corrective Wave-A completion at 7511.10 on 24-03-2020 and Wave-B beginning
2- Wave-a of Wave-B completion at 9889.05 on 30-04-2020
3- Wave-b of Wave-B completion at 8806.75 on 16-05-2020
4- Wave-c of Wave-B continuation with recent top formation at 10177.8 on 05-06-2020

Conclusions from EOD chart analysis
(Wave-B structure)

Wave-c of Wave-B continuation with recent top formation last Friday at 10177.8 and no indication of its completion yet.

Nifty-EOD Chart Analysis
(Bollinger Band & Stochastic)
Nifty-EOD Chart (05-Jun-2020):-

Technical Patterns and Formations in EOD charts

1- Hovering around upper band of Bollinger Band
2- Stochastics showing negative divergence 
3- Stochastic-%K(5) is at 86.79 & %D(3) is at 88.89

Conclusions from EOD chart analysis
(Bollinger Band & Stochastics)

Nifty is hovering around upper band of Bollinger Band for the last 3 sessions and Short Term indicator Stochastics is also showing negative divergence in Overbought zone because Nifty is moving up and Stochastics is moving down therefore caution and Short Term Correction signals are being generated by these 2 indicators 

Nifty-EOD Chart Analysis
(Fibonacci Extension levels)
Nifty-EOD Chart (05-Jun-2020):-

Technical Patterns and Formations in EOD charts

1- Wave-A(7511.10 on 24-03-2020)
2- Wave-a of Wave-B(9889.05 on 30-04-2020)
3- Wave-a of Wave-B gained 2377.95 points
4- Wave-b of Wave-B(8806.75 on 16-05-2020)
5- Wave-c of Wave-B continuation with recent top formation at 10177.8 on 05-06-2020
6- 61.8% Fibonacci Extension Target of Wave-c of Wave-B is at 10276.32{8806.75+1469.57(61.8% of 2377.95)}
7- 100% Fibonacci Extension Target of Wave-c of Wave-B is at 11184.70{8806.75+2377.95(100% of 2377.95)}

Conclusions from EOD chart analysis
(Fibonacci Extension levels)

Wave-c of Wave-B is very much on and no confirmation of its completion yet as well as its continuation is expected towards its following next Fibonacci Extension Targets:-

1- 61.8%-10276.32 
2- 100.0%-11184.70

Nifty-Intra Day Chart Analysis
(05-Jun-2020)
Nifty-Intra Day Chart (05-Jun-2020):-

Technical Patterns formation in today intraday charts

1- Minor selling between 120123-10145
2- Sharp fall in first hour
3- Up moves with downward corrections
4- Consolidation in last hour between 10116-10150
5- Whole day actual trading between 10041-10177

Conclusions from intra day chart analysis 

Although sharp fall in first hour after minor selling but after that nore than 3 hours up moves with downward corrections and consolidation was also seen in last hour therefore up moves above last Friday highest(10,177.80) will be seen in the beginning of next week because whole day good consolidation and only minor selling last Friday.

Conclusions
(After Putting All Studies Together)

1- Long term trend is down and it will be up after sustaining above its decider 200-Day SMA(Today at 10965.1)
2- Intermediate term trend is up
3- Short term trend is up

Corrective Wave-A of "ABC" correction completed at 7511.10 on 24-03-2020 and now its Wave-c of Wave-B continuation with recent top formation at 10177.8 on 05-06-2020 and no indication of its completion yet,its Fibonacci Extension Targets with calculations{61.8%(10276.32) and 100%(11184.70)} has been updated above and its continuation is expected towards them.

As Short Term indicator Stochastics is also showing negative divergence in Overbought zone therefore Short Term correction may be seen any day but firstly on going rally will remain continued in the beginning of next week because intraday charts of last Friday are showing good consolidation and very little selling patterns formations. Let selling patterns develop on intraday charts then correction will be considered which may be sideways also and deeper correction will be seen only after complete selling patterns formations.

Next resistances of Nifty are as follows:-

1- 10159-10294(Gap Resistance)
2- 10401-10520
3- 10752-11828(Gap Resistance)
4- 10893-11007
5- 11184-11409(Strong Resistances)

Next supports of Nifty are as follows:-

1- 10116-10150 
2- 9945-9984 
3- 9875-9907
4- 9599-9706(Gap support)
5- 9445-9520(Strong supports)

Rally is on and its continuation is expected in the beginning of next week towards above mentioned levels but emergence of Short Term Correction expectations only which may be sideways also and deeper correction will be considered only after complete selling patterns formations on intraday charts.
Levels will confirm next next Short Term Trend 
Intra Day Chart Analysis & Market Outlook
(05-06-2020)
Nifty-Intra Day Chart (04-Jun-2020):-
Just click on chart for its enlarged view
Technical Patterns formation in today intraday charts

1- Sharp fall after opening
2- Selling between 10044-10085
3- Down moves in Bullish Falling Channel
4- Consolidation between 9945-9984
5- Last 2 hours Mixed Patterns formation between 99888-10033
6- Whole day actual trading between 9945-10123

Conclusions from intra day chart analysis 

As last 2 sessions trading between 9945-10176 with higher levels selling and lower levels consolidation today therefore firstly Nifty will have to trade and prepare for next decisive moves within or near about this trading range and finally sustaining beyond this range will confirm next decisive moves. 

Short Term correction was expected and it begun today but consolidation was seen below 10000 therefore Short Term correction in sideways market can not be ruled out and deeper correction will be considered only after complete fresh selling. If today like trend of higher levels selling and lower levels buying will remain continued then correction in sideways market will also be considered.

Firstly sustaining beyond 9945-10176 should be watched for next Short Term Trend confirmations which will be any one of two above mentioned possibilities(deeper correction or correction in sideways market).
Today lowest will confirm Short Term correction beginning 
Intra Day Chart Analysis & Market Outlook
(04-06-2020)
Nifty-Intra Day Chart (03-Jun-2020):-
Just click on chart for its enlarged view
Technical Patterns formation in today intraday charts

1- Sharp fall after strong opening
2- Whole day slow up moves
3- Sharp fall in last hour
4- Whole day actual trading between 10036-10176

Conclusions from intra day chart analysis 

As all the Global markets were blasting therefore strong opening of Indian markets but firstly sharp fall immediately after opening and after that slow up moves were seen which is a selling pattern hence sharp fall again in last hour today.

Whole day today trading with volatility and some selling also is telling that follow up selling tomorrow and slipping below today lowest(10035.55) will mean Short Term correction beginning confirmation. 
Short Term correction after 1/2 sessions follow up selling
Intra Day Chart Analysis & Market Outlook
(03-06-2020)
Nifty-Intra Day Chart (02-Jun-2020):-

Just click on chart for its enlarged view
Technical Patterns formation in today intraday charts

1- Sharp up after opening
2- Selling between 9913-9932
3- Down moves in Bullish Falling Channel
4- Consolidation between 9875-9907
5- Sharp up after European markets strong opening
6- Last 2 hours slow up moves
7- Whole day actual trading between 9824-9995

Conclusions from intra day chart analysis

Although some selling in first hour but after that consolidation was also seen therefore sharp up after European markets strong opening and Dow Jones's Futures strong recovery from lower levels. As last 2 hours up moves were slow which is a selling indication also therefore view will not be Bullish despite today closing at the highest of today.

As some selling was seen yesterday and follow up selling today as well as Short Term indicators have turned Over Bought therefore same yesterday updated view that decisive down moves(Short Term correction) are expected also after 1/2 sessions follow up selling. 
Decisive down moves beginning expectations
Intra Day Chart Analysis & Market Outlook
(02-06-2020)
Nifty-Intra Day Chart (01-Jun-2020):-
Just click on chart for its enlarged view
Technical Patterns formation in today intraday charts

1- Consolidation between 9793-9850
2- Up moves in Bearish Rising Channel
3- Selling between 9882-9931 
4- Support between 9810-9832
5- Selling between 9852-9876
6- Down moves in Bullish Falling Channel
7- Whole day actual trading between 9707-9931

Conclusions from intra day chart analysis 

Following lines were told on 30-05-2020 in "Firstly up moves and Short Term Correction after fresh selling patterns" formations":-

1- As Nifty closed at 9580.30 last Friday and next resistances are starting from 9850 2- therefore expected that Nifty will firstly trade within this range
2- Firstly up moves will be seen and Short Term Correction will be considered only after complete fresh selling patterns formations on intraday charts.

As was told 100% same happened and Nifty traded firstly within mentioned(9580.30-9850) and 351 points up moves have been seen today. 

Although some consolidation was seen at lower levels in first and last hour but higher levels good selling was also seen today therefore follow up selling within today trading range tomorrow will mean decisive down moves beginning towards next supports(9454-9520) and decisive down moves are expected also after 1/2 sessions follow up selling because Short Term indicators have turned Overbought and higher levels good selling patterns formations today..

Decisive down moves beginning expectations

Decisive down moves beginning expectations
Intra Day Chart Analysis & Market Outlook
(02-06-2020)
Nifty-Intra Day Chart (01-Jun-2020):-
Just click on chart for its enlarged view
Technical Patterns formation in today intraday charts

1- Consolidation between 9793-9850
2- Up moves in Bearish Rising Channel
3- Selling between 9882-9931 
4- Support between 9810-9832
5- Selling between 9852-9876
6- Down moves in Bullish Falling Channel
7- Whole day actual trading between 9707-9931

Conclusions from intra day chart analysis 

Following lines were told on 30-05-2020 in "Firstly up moves and Short Term Correction after fresh selling patterns" formations":-

1- As Nifty closed at 9580.30 last Friday and next resistances are starting from 9850 2- therefore expected that Nifty will firstly trade within this range
2- Firstly up moves will be seen and Short Term Correction will be considered only after complete fresh selling patterns formations on intraday charts.

As was told 100% same happened and Nifty traded firstly within mentioned(9580.30-9850) 351 points up moves will be seen today. 

Although some consolidation was seen at lower levels in first and last hour but higher levels good selling was also seen today therefore follow up selling within today trading range tomorrow will mean decisive down moves beginning towards next supports(9454-9520) and decisive down moves are expected also after 1/2 sessions follow up selling because Short Term indicators have turned Overbought and higher levels good selling patterns formations today..
Firstly up moves and Short Term Correction after fresh selling patterns formations
Technical Analysis,Research & Weekly Outlook
(Jun 01 to Jun 05,2020)
Following conclusive lines were told on 23-05-2020 in the part of "Nifty-Intra Day Chart Analysis(22-May-2020)" in "45 Sessions sideways market suggesting to follow next supports,resistances and Short Term Trend/Indicators":-

if Nifty sustains above 9072 after follow up consolidation then more up moves will be seen in next week

As was told 100% same happened and Nifty closed last Friday after 540 points weekly gains.

Nifty-EOD Chart Analysis
(Corrective Waves)
Nifty-EOD Chart (29-May-2020):-
Technical Patterns and Formations in EOD charts

1- Impulsive Wave-5 completion at 12430.50 on 20-01-2020 and Wave-A of "corrective ABC Waves" beginning
2- Corrective Wave-A completion at 7511.10 on 24-03-2020 and Wave-B beginning
3- Wave-a of Wave-B completion at 9889.05 on 30-04-2020
4- Wave-b of Wave-B completion at 8806.75 on 16-05-2020
5- Wave-c of Wave-B continuation with recent top formation at 9598.85 on 29-05-2020

Conclusions from EOD chart analysis
(Corrective Waves)

Now Wave-c of Wave-B continuation with recent top formation at 9,598.85 on 29-05-2020 and its continuation is expected because at present no selling patterns formations on EOD charts.

Nifty-EOD Chart Analysis
(Averages & Stochastic)
Nifty-EOD Chart (29-May-2020)(Averages & Stochastic):-
Technical Patterns and Formations in EOD charts

1- Impulsive Wave-5 completion at 12430.50 on 20-01-2020 and Wave-A of "corrective ABC Waves" beginning
2- Corrective Wave-A completion at 7511.10 on 24-03-2020 and Wave-B beginning
3- Wave-B continuation with recent top formation at 9889.05 on 30-04-2020
4- SMA(Simple Moving Averages)
A- 5-Day SMA is at 9290
B- 13-Day SMA is at 9168
C- 55-Day SMA is at 9128
D- 200-Day SMA is at 10988
5- Stochastic-%K(5) is at 96.33 & %D(3) is at 82.98

Conclusions from EOD chart analysis
(Averages & Stochastic)

Nifty is showing strength because now trading above all Short Term(5,13) and Intermediate Term(55) averages but Stochastic has turned Over bought therefore Short Term correction may begin in next week. As intraday selling patterns were not seen in last 3 sessions therefore let selling patterns develop on intraday charts then Short Term correction will be considered.

Nifty-EOD Chart Analysis
(Fibonacci retracement levels)
Nifty-EOD Chart (29-May-2020):-
Technical Patterns and Formations in EOD charts

Nifty-Fibonacci Retracement levels of corrective Wave-A(7511.1 to 12430.50):-

1- 13.0%- 8150 (Retraced)
2- 23.6%- 8672 (Retraced)
3- 27.0%- 8839 (Retraced)
4- 38.2%- 9390 (Crucial)(Retraced)
5- 50.0%- 9970 (Crucial)
6- 61.8%- 10551(Crucial)
7- 70.7%- 10989
8- 76.4%- 11269
9- 78.6%- 11377
10-88.6%- 11869

Conclusions from EOD chart analysis
(Fibonacci retracement levels)

As 38.2% Retracement has been completed and good rally was seen in last 3 sessions of previous week and no selling patterns formations therefore its continuation will be considered towards next 50% crucial level(9970).

Nifty-Intra Day Chart Analysis
(29-May-2020)
Nifty-Intra Day Chart (29-May-2020):-
Technical Patterns formation in today intraday charts

1- Up moves with downward corrections
2- More than 2 hours consolidation between 9454-9520
3- Up moves with downward corrections
4- Whole day actual trading between 9377-9598

Conclusions from intra day chart analysis

As all the up moves were with downward corrections and more than 2 hours consolidation was also seen in Mid-session therefore last Friday week started rally will remain continued towards next resistances in the beginning of next week.

Conclusions
(After Putting All Studies Together)

1- Long term trend is down.
2- Intermediate term trend is up
3- Short term trend is up

Nifty traded sideways between 8807-9584 for the last 20 sessions and last Friday closing was at the top of this range at 9580.30 and no selling patterns formations therefore rally continuation is expected towards following next resistances:-

1- 9850-9889
2- 9955-10142

Next supports of Nifty are as follows:-

1- 9454-9520
2- 9255-9285
3- 9087-9112
4- 8977-9046
5- 8920-8968
6- 8860-8905
7- 8807-8835

Wave-c of Wave-B continuation with recent top formation at 9598.85 and its continuation is expected above Wave-a of Wave-B(9889.05) because Nifty has closed at the top of last 20 sessions trading range(8807-9584) last Friday at 9580.30 and Intermediate term trend has also turned up.

As Short Term Indicator Stochastic has become Overbought therefore Short Term Correction may be seen in next week but firstly 1/2 sessions selling is firstly required which has not been seen yet,let it happen in next week firstly then Short Term Correction will be considered and will be seen as well.

As Nifty closed at 9580.30 last Friday and next resistances are starting from 9850 therefore expected that Nifty will firstly trade within this range and until Nifty will not sustain below 9454 after complete selling till then decisive down moves will not be seen.

Firstly up moves will be seen and Short Term Correction will be considered only after complete fresh selling patterns formations on intraday charts.
Firstly up moves and Short Term Correction after fresh selling patterns formations
Technical Analysis,Research & Weekly Outlook
(Jun 01 to Jun 05,2020)
Following conclusive lines were told on 23-05-2020 in the part of "Nifty-Intra Day Chart Analysis(22-May-2020)" in "45 Sessions sideways market suggesting to follow next supports,resistances and Short Term Trend/Indicators":-

if Nifty sustains above 9072 after follow up consolidation then more up moves will be seen in next week

As was told 100% same happened and Nifty closed last Friday after 540 points weekly gains.

Nifty-EOD Chart Analysis
(Corrective Waves)
Nifty-EOD Chart (29-May-2020):-
Technical Patterns and Formations in EOD charts

1- Impulsive Wave-5 completion at 12430.50 on 20-01-2020 and Wave-A of "corrective ABC Waves" beginning
2- Corrective Wave-A completion at 7511.10 on 24-03-2020 and Wave-B beginning
3- Wave-a of Wave-B completion at 9889.05 on 30-04-2020
4- Wave-b of Wave-B completion at 8806.75 on 16-05-2020
5- Wave-c of Wave-B continuation with recent top formation at 9598.85 on 29-05-2020

Conclusions from EOD chart analysis
(Corrective Waves)

Now Wave-c of Wave-B continuation with recent top formation at 9,598.85 on 29-05-2020 and its continuation is expected because at present no selling patterns formations on EOD charts.

Nifty-EOD Chart Analysis
(Averages & Stochastic)
Nifty-EOD Chart (29-May-2020)(Averages & Stochastic):-
Technical Patterns and Formations in EOD charts

1- Impulsive Wave-5 completion at 12430.50 on 20-01-2020 and Wave-A of "corrective ABC Waves" beginning
2- Corrective Wave-A completion at 7511.10 on 24-03-2020 and Wave-B beginning
3- Wave-B continuation with recent top formation at 9889.05 on 30-04-2020
4- SMA(Simple Moving Averages)
A- 5-Day SMA is at 9290
B- 13-Day SMA is at 9168
C- 55-Day SMA is at 9128
D- 200-Day SMA is at 10988
5- Stochastic-%K(5) is at 96.33 & %D(3) is at 82.98

Conclusions from EOD chart analysis
(Averages & Stochastic)

Nifty is showing strength because now trading above all Short Term(5,13) and Intermediate Term(55) averages but Stochastic has turned Over bought therefore Short Term correction may begin in next week. As intraday selling patterns were not seen in last 3 sessions therefore let selling patterns develop on intraday charts then Short Term correction will be considered.

Nifty-EOD Chart Analysis
(Fibonacci retracement levels)
Nifty-EOD Chart (29-May-2020):-
Technical Patterns and Formations in EOD charts

Nifty-Fibonacci Retracement levels of corrective Wave-A(7511.1 to 12430.50):-

1- 13.0%- 8150 (Retraced)
2- 23.6%- 8672 (Retraced)
3- 27.0%- 8839 (Retraced)
4- 38.2%- 9390 (Crucial)(Retraced)
5- 50.0%- 9970 (Crucial)
6- 61.8%- 10551(Crucial)
7- 70.7%- 10989
8- 76.4%- 11269
9- 78.6%- 11377
10-88.6%- 11869

Conclusions from EOD chart analysis
(Fibonacci retracement levels)

As 38.2% Retracement has been completed and good rally was seen in last 3 sessions of previous week and no selling patterns formations therefore its continuation will be considered towards next 50% crucial level(9970).

Nifty-Intra Day Chart Analysis
(29-May-2020)
Nifty-Intra Day Chart (29-May-2020):-
Technical Patterns formation in today intraday charts

1- Up moves with downward corrections
2- More than 2 hours consolidation between 9454-9520
3- Up moves with downward corrections
4- Whole day actual trading between 9377-9598

Conclusions from intra day chart analysis

As all the up moves were with downward corrections and more than 2 hours consolidation was also seen in Mid-session therefore last Friday week started rally will remain continued towards next resistances in the beginning of next week.

Conclusions
(After Putting All Studies Together)

1- Long term trend is down.
2- Intermediate term trend is up
3- Short term trend is up

Nifty traded sideways between 8807-9584 for the last 20 sessions and last Friday closing was at the top of this range at 9580.30 and no selling patterns formations therefore rally continuation is expected towards following next resistances:-

1- 9850-9889
2- 9955-10142

Next supports of Nifty are as follows:-

1- 9454-9520
2- 9255-9285
3- 9087-9112
4- 8977-9046
5- 8920-8968
6- 8860-8905
7- 8807-8835

Wave-c of Wave-B continuation with recent top formation at 9598.85 and its continuation is expected above Wave-a of Wave-B(9889.05) because Nifty has closed at the top of last 20 sessions trading range(8807-9584) last Friday at 9580.30 and Intermediate term trend has also turned up.

As Short Term Indicator Stochastic has become Overbought therefore Short Term Correction may be seen in next week but firstly 1/2 sessions selling is firstly required which has not been seen yet,let it happen in next week firstly then Short Term Correction will be considered and will be seen as well.

As Nifty closed at 9580.30 last Friday and next resistances are starting from 9850 therefore expected that Nifty will firstly trade within this range and until Nifty will not sustain below 9454 after complete selling till then decisive down moves will not be seen.

Firstly up moves will be seen and Short Term Correction will be considered only after complete fresh selling patterns formations on intraday charts.
As not feeling well therefore Stock Market Outlook of today(28-05-2020) is not being updated.
8969-9072 Will confirm next decisive moves
Intra Day Chart Analysis & Market Outlook
(27-05-2020)
Nifty-Intra Day Chart (26-May-2020):-
Just click on chart for its enlarged view
Technical Patterns formation in today intraday charts

1- Selling between 9085-9146
2- Support between 8997-9061
3- Whole day actual trading between 8997-9161

Conclusions from intra day chart analysis 

Following conclusive lines were told on 23-05-2020 in the part of "Nifty-Intra Day Chart Analysis(22-May-2020)" in "45 Sessions sideways market suggesting to follow next supports,resistances and Short Term Trend/Indicators ":-

1-  last 5 hours sideways trading between 8969-9072 and negative closing also but some consolidation was also seen within this range
2- if Nifty sustains above 9072 after follow up consolidation then more up moves will be seen in next week

Consolidation was told and firstly up moves were seen and Nifty traded with 120 points gains also today but fresh selling developed therefore Nifty could not sustain at higher levels and closed below 9072 at 9029.05 today.

As some consolidation was seen between 8969-9072 last Friday and nifty got supports within this range between 8997-9061 today therefore firstly follow up moves and finally sustaining beyond 8969-9072 should be watched tomorrow for next decisive moves towards following levels:-

1- Resistances above 9072:-
A- 9095-9120
B- 9147-9178 
C- 9200-9231
2-Supports below 8969:-
A- 8920-8968
B- 8860-8905
C- 8807-8835
45 Sessions sideways market suggesting to follow next supports,resistances and Short Term Trend/Indicators 
Technical Analysis,Research & Weekly Outlook
(May 26 to May 29,2020)
Nifty-EOD Chart Analysis
(Waves structure)
Nifty-EOD Chart (22-May-2020):-

Technical Patterns and Formations in EOD charts

1- Impulsive Wave-1 beginning from 6825.80 on 29-02-2016 after 1 financial year(2015-16) correction completion
2- Impulsive Wave-1 completion at 8968.70 on 07-09-2016 and corrective Wave-2 beginning
3- Corrective Wave-2 completion at 7893.80 on 26-12-2016 and impulsive Wave-3 beginning
4- Impulsive Wave-3 completion at 11171.50 on 29-01-2018 and corrective Wave-4 beginning
5- Corrective Wave-4 completion at 9951.90 on 23-03-2018 and impulsive Wave-5 beginning
6- Impulsive Wave-5 completion after new life time high formation at 12430.50 on 20-01-2020 and Wave-A of "corrective ABC Waves"  beginning
7- Corrective Wave-A completion at 7511.10 on 24-03-2020 and Wave-B beginning
8- Wave-B continuation with recent top formation at 9889.05 on 30-04-2020
9- Short Term correction of Wave-B continuation with recent bottom formation at 8806.75 on 18-05-2020

Conclusions from EOD chart analysis
(Waves structure)

The rally which started from 6825.80 on 29-02-2016 completed at 12430.50 on 20-01-2020 and then corrective Wave-A of its "ABC" correction begun which completed at 7511.10 on 24-03-2020.

Now impulsive Wave-B of "ABC" correction is in continuation with recent top formation at 9889.05 on 30-04-2020 and no confirmation of its completion yet.Now Short Term correction of Wave-B continuation with recent bottom formation at 8806.75 on 18-05-2020.

Nifty-EOD Chart Analysis
(Waves structure of Wave-B)
Nifty-EOD Chart (27-Mar-2020):-

Technical Patterns and Formations in EOD charts

1- Impulsive Wave-1 of Wave-B beginning after corrective Wave-A completion at 7511.10 on 24-03-2020
2- Impulsive Wave-1 completion at 9038.90 on 27-03-2020 and corrective Wave-2 beginning
3- Corrective Wave-2 completion at 8055.80 on 03-04-2020 and impulsive Wave-3 beginning
4- Impulsive Wave-3 completion at 9390.85 on 20-04-2020 and corrective Wave-4 beginning
5- Corrective Wave-4 completion at 8909.40 on 21-04-2020 and impulsive Wave-5 beginning
6- Impulsive Wave-5 of Wave-B continuation with recent top formation at 9889.05 on 30-04-2020
7- Short Term correction of Wave-B continuation with recent bottom formation at 8806.75 on 18-05-2020 
8- Last 15 Sessions sideways trading between 8807-9584 

Conclusions from EOD chart analysis
(Waves structure of Wave-B)

Impulsive Wave-1 of Wave-B begun after corrective Wave-A completion at 7511.10 on 24-03-2020. Now Impulsive Wave-5 of Wave-B continuation with recent top formation at 9889.05 on 30-04-2020.

At present Short Term correction of impulsive Wave-5 of Wave-B is on with recent bottom formation at 8806.75 on 18-05-2020. 

Nifty
Last 15 Sessions intraday charts analysis 
Nifty-Intra Day Chart (May 04 to May 22,2020):-

Technical Patterns formation in last 15 Sessions intraday charts

1- Down moves in Bullish Falling Channels in first 4 sessions
2- Selling(Resistances) in last 15 sessions between
A- 9095-9120
B- 9147-9178 
C- 9200-9231
D- 9250-9281
E- 9300-9355
F- 9352-9426
3- Consolidation(Supports) in last 15 sessions
A- 8920-8968
B- 8860-8905
C- 8807-8835
4- 15 Sessions actual trading between 8807-9584

Conclusions from 15 Sessions
intra day chart analysis 

As lower levels 3 supports and higher levels 6 resistances in last 15 sessions sideways trading range therefore firstly Nifty will have to trade and prepare for next decisive big moves between 8807-9584 and finally sustaining beyond this range should be watched in the coming week for next one sided big moves beginning confirmations. 

Nifty-Intra Day Chart Analysis
(22-May-2020)
Nifty-Intra Day Chart (22-May-2020):-

Technical Patterns formation in today intraday charts

1- Sharp up after opening
2- Selling between 9095-9120
3- Volatility during RBI Governor Press Conference
4- Sharp fall after RBI Governor Press Conference
5- Sideways trading in last 5 hours between 8969-9072
6- Whole day actual trading between 8969-9149

Conclusions from intra day chart analysis 

As positive announcements expectations from RBI Governor Press Conference at 10;00 AM on 22-05-2020 therefore firstly sharp up after opening but selling developed on these expectations hence Volatility during Press Conference and sharp fall was seen after Press Conference. 

Although last 5 hours sideways trading between 8969-9072 and negative closing also but some consolidation was also seen within this range therefore if Nifty sustains above 9072 after follow up consolidation then more up moves will be seen in next week.

Conclusions
(After Putting All Studies Together)

1- Long term trend is down.
2- Intermediate term trend is sideways
3- Short term trend is sideways between 8807-9584 for the last 15 sessions

As Coronavirus panic therefore extremely fast Price-wise correction of Wave-A was seen which completed at 7511.10 on 24-03-2020 but Time-wise is still left which is being seen in on going Wave-B for the last 39 sessions between 7511-9889. It is confirm that Time-wise correction will remain continued till longer period because market will firstly wait for complete normalization Coronavirus situation and after that economic and Industrial growth coming on track which will take its own time and that may be much longer also.

At present Nifty is sideways between 8807-9584 for the last 15 sessions and expected that Nifty will firstly trade and prepare for next decisive big moves within this range,let it happen then will be understood and updated according to coming sessions intraday charts patterns formations. Supports and resistances within last 15 sessions trading range have already been updated above and beyond this range are as follows:-. 

Next resistances above 9584 are as follows:- 

1- 9850-9889
2- 9955-10142

Next supports below 8807 are as follows:-

1- 8700-8750
2- 8361-8449
3- 8056-8107
4- 7512-7970

As Nifty is sideways between 7512-9889 and not trending for the last 45 sessions therefore trading should be done according to:-

1- Short Term Trend 
2- Short Term Indicators
3- Above mentioned 7 supports and 8 resistances within last 45 sessions 

As Coronavirus news/Global markets big moves led huge volatility may also be seen any day therefore it should also be cautiously kept in mind. 
Sustaining beyond 9057 will confirm next decisive moves 
Intra Day Chart Analysis & Market Outlook
(22-05-2020)
Nifty-Intra Day Chart (21-May-2020):-
Just click on chart for its enlarged view
Technical Patterns formation in today intraday charts

1- Consolidation between 9108-9150
2- Selling between 9147-9178 
3- Down moves with upward corrections
4- Whole day actual trading between 9057-9178

Conclusions from intra day chart analysis 

Following lines were told on 19-05-2020 in "Fresh consolidation between 8807-8918 will mean Pull Back rally":-

Short Term indicators have turned Oversold and if fresh consolidation develops between 8807-8918 then Pull Back rally will be seen in the next 2/3 sessions.

Pull Back rally was seen and Nifty closed in Green in both previous sessions 

Although firstly almost 3 hours consolidation and some up moves also seen after that but higher levels some selling was also seen at higher levels and after that Down moves with upward corrections therefore today closing was near the lower levels of the day. 

Next resistances above today highest are between 9200-9231 and fresh selling was seen below it today but fresh follow up selling is firstly required tomorrow for decisive down moves beginning because Indian markets out performed all Global markets and whole day traded in Green despite too much weakness in Dow Jones's Futures and all European markets. 

Expected that Nifty will firstly trade and prepare for next moves near about today lowest(9057) and finally sustaining it beyond will confirm next decisive moves.
As busy therefore Stock Market Outlook of today(21-05-2020) is not being updated.
Fresh consolidation between 8807-8918 will mean Pull Back rally
Intra Day Chart Analysis & Market Outlook
(20-05-2020)
Nifty-Intra Day Chart (19-May-2020):-
Just click on chart for its enlarged view
Technical Patterns formation in today intraday charts

1- Volatility in first half hour after Green opening
2- Up moves in Bearish Rising Channel
3- Selling between 8957-9002
4- Sideways trading between 8858-8918 in last 2 hours
5- Whole day actual trading between 8856-9030

Conclusions from intra day chart analysis 

When most Bullish sentiments then we were cautious and told following conclusive lines at 12:34 AM today in "Firstly watch 8807-8948 after most Bullish Global markets sentiment due to hopes for potential coronavirus vaccine":-

firstly sustaining beyond 8807-8948 should be watched in the coming sessions for next decisive moves beginning confirmations. 

Although strong opening today but not sustaining above 8948 and Nifty closed below it at 8879.10 today after selling at higher levels. 

As sideways trading between 8858-8918 in last 2 hours today and minor consolidation was also seen within this range therefore firstly sustaining it beyond should be watched in the coming sessions for next decisive moves beginning confirmations because Short Term indicators have turned Oversold and if fresh consolidation develops between 8807-8918 then Pull Back rally will be seen in the next 2/3 sessions.
Firstly watch 8807-8948 after most Bullish Global markets sentiment due to hopes for potential coronavirus vaccine
Intra Day Chart Analysis & Market Outlook
(19-05-2020)
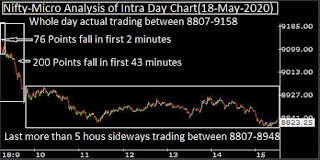
Nifty-Intra Day Chart (18-May-2020):-
Just click on chart for its enlarged view
Technical Patterns formation in today intraday charts

1- 76 Points fall in first 2 minutes
2- 200 Points fall in first 43 minutes 
3- Last more than 5 hours sideways trading between 8807-8948
4- Whole day actual trading between 8807-9158

Conclusions from intra day chart analysis 

Although Dow Jones's Futures was trading more than 250 points up and all the Asian markets except Taiwan were trading in Green today morning but sharp fall was seen in Indian markets through 76 Points fall in first 2 minutes and 200 Points fall in first 43 minutes. In this manner Indian markets completely under performed all the Global markets because Nifty traded almost whole day more than 2% down despite more than 2% positive and strong trading of most European markets.

As Nifty traded sideways more than 5 hours at 2% to 3% down rates between 8807-8948 with such huge under performing Global markets therefore good selling can not be ruled out here and finally down moves below Day's lowest(8807) is expected despite following most Bullish Global markets at this moment today:-

1- Dow Jones is trading more than 900 points up.
2- Most European markets closed more than 4% up 
3- SGX Nifty is now trading more than 200 points up.

As all the Global markets have surged on hopes for potential coronavirus vaccine therefore sentiment has turned most Bullish hence firstly sustaining beyond 8807-8948 should be watched in the coming sessions for next decisive moves beginning confirmations. 
Trading should be according to supports and resistances of last 40 sessions Wave-B levels
Technical Analysis,Research & Weekly Outlook
(May 18 to May 22,2020)
Nifty-EOD Chart Analysis
(Corrective Waves)
Nifty-EOD Chart (15-May-2020):-

Technical Patterns and Formations in EOD charts

1- Impulsive Wave-5 completion at 12430.50 on 20-01-2020 and Wave-A of "corrective ABC Waves" beginning
2- Corrective Wave-A completion at 7511.10 on 24-03-2020 and Wave-B beginning
3- Wave-B continuation with recent top formation at 9889.05 on 30-04-2020
4- Short Term correction beginning with recent bottom formation at 9043.95 on 12-05-2020 

Conclusions from EOD chart analysis 
(Corrective Waves)

Impulsive Wave-5 completed at 12430.50 on 20-01-2020 and after that Wave-A of "corrective ABC Waves" begun which finished at 7511.10 on 24-03-2020 and then Wave-B started,that is in continuation with recent top formation at 9889.05 on 30-04-2020. Now Short Term correction of Wave-B is on with recent bottom formation at 9043.95 on 12-05-2020. 
Nifty-EOD Chart Analysis
(Averages & MACD)
Nifty-EOD Chart (15-May-2020):-

Technical Patterns and Formations in EOD charts

1- SMA(Simple Moving Averages)
A- 5-Day SMA is at 9219
B- 13-Day SMA is at 9316
C- 55-Day SMA is at 9520
D- 200-Day SMA is at 11081
2- MACD-(S,9,S,9,S,24 Close)(-7.62,211.94)

Conclusions from EOD chart analysis (Averages)

As Nifty has closed below all the above Long,Intermediate and Short term SMA and MACD is also showing downward cross over therefore strong signals of more down moves in next week.
Nifty
Last 10 Sessions intraday charts analysis
Nifty-Intra Day Chart (May 04 to May 15,2020):-

Technical Patterns formation in last 10 Sessions intraday charts

1- Down moves in Bullish Falling Channels in first 4 sessions
2- Selling(Resistances) in last 10 sessions between
A- 9352-9426
B- 9300-9355
C- 9250-9281
D- 9200-9231
3- Consolidation(Supports) in last 10 sessions
A- 9050-9090
B- 9044-9146
4- 10 Sessions actual trading between 9044-9584 

Conclusions from 10 Sessions intra day chart analysis 

As firstly consolidation through Down moves in Bullish Falling Channels in first 4 sessions of last 10 sessions therefore decisive up moves were seen in last 4 sessions but fresh selling developed at higher levels hence slipping to lower levels of last 10 sessions trading range in last week.

Clear consolidation at lower levels between 9044-9146 in last 4 sessions and good selling also at higher levels between 9200-9426 in last 6 sessions therefore firstly Nifty will have to trade and prepare for next decisive moves within this range and finally sustaining beyond this range will generate next big moves in the coming week/weeks.
Nifty
Last 2 Sessions intraday charts analysis
Nifty-Intra Day Chart (May 14 & May 15,2020):-

Technical Patterns formation in last 2 Sessions intraday charts

1- Selling between 9250-9281 on 14-05-2020(Immediate Resistances)
2- Selling between 9200-9231 on 14-05-2020(Immediate Resistances)
3- Consolidation between 9050-9090 on 15-05-2020(Immediate Supports)
4- 2 Sessions actual trading between 9050-9281

Conclusions from 2 Sessions intra day chart analysis 

Nifty consolidated between 9044-9146 on 12-05-2020 and again consolidated within this range between 9050-9090 as well as closed within this range at 9136.85 on 15-05-2020 therefore this range(9044-9146) has become most crucial because finally sustaining beyond this range will give first signal of next decisive moves beginning in next week.

As good selling also between 9200-9281 on 14-05-2020 therefore follow up consolidation is firstly required for sustaining above 9281 hence Nifty will firstly trade within 9044-9281 in next week and finally valid break out of this range will generate more than 3% one sided decisive moves.

Conclusions 
(After Putting All Studies Together)

1- Long term trend is down.
2- Intermediate term trend is sideways between 9044-9584 for the last 10 sessions
3- Short term trend is down

Although 10% Lower circuit filter triggered on 13-03-2020 but Nifty recovered 1604.25 points from lower levels and closed at the higher levels of the day that day. Nifty opened much weaker on next trading day(16-03-2020) and since then trading sideways between 7512-9889 for the last 40 sessions. As Wave-B formation has been seen within this range therefore now whole Wave-B will be understood sideways within this range.

As no confirmation of Wave-B completion yet therefore its continuation will be considered with recent top formation at 9889.05 on 30-04-2020. Now Short Term correction of Wave-B is on with recent bottom formation at 9043.95 on 12-05-2020 and also no confirmation of its completion yet also. 

Nifty is sideways between 9044-9584 for the last 10 sessions with higher levels good selling and lower levels some supports also within this range. Supports and resistances between 9044-9584 have been updated above and beyond this range are as follows:-

Next resistances above 9584 are as follows:- 

1- 9850-9889
2- 9955-10142

Next supports below 9044 are as follows:-

1- 8913-8972
2- 8700-8750
3- 8361-8449
4- 8056-8107
5- 7512-7970

Last 40 sessions sideways trading between 7512-9889 with Covid-19 Global markets news led highly volatile which will remain continued until any 100% positive situation will not develop regarding it.

As above mentioned multiple supports and resistances are lying between 7512-9889 therefore Nifty will trade within this range in the coming weeks and months. Wave-B formation and its on going Short Term Correction is also lying within this range therefore finally break out of this sideways range will decide the life of Wave-B,let it happen then will be decided accordingly and till then trading should be done according to supports and resistances of last 40 sessions Wave-B levels. 
As busy therefore Stock Market Outlook of today(15-05-2020) is not being updated.
Levels will confirm next targets
Intra Day Chart Analysis & Market Outlook
(14-05-2020)
Nifty-Intra Day Chart (13-May-2020):-
Just click on chart for its enlarged view
Technical Patterns formation in today intraday charts

1- 232 Points fall in first half hour after after 387 points gap up opening
2- Sideways trading between 9352-9426 in last 6 hours
3- Whole day actual trading between 9352-9584

Conclusions from intra day chart analysis 

Although firstly 387 points gap up opening after PM Modi ji 20 Lac Crore package yesterday but not sustaining at higher levels 232 Points sharp fall was seen in first half hour.  

As sideways trading between 9352-9426 in last 6 hours and one sided clear patterns formations were not seen within it therefore firstly sustaining it beyond should be watched tomorrow for following next targets confirmations:-

1- Next supports below 9352 are between 9044-9146
2- Next resistances above 9426 are between 9850-9889
Decisive up moves after 20 Lac crores package by our most respected PM Narenda Modi ji
Intra Day Chart Analysis & Market Outlook
(13-05-2020)
Nifty-Intra Day Chart (12-May-2020):-
Just click on chart for its enlarged view
Technical Patterns formation in today intraday charts

1- Consolidation between 9044-9146(Immediate Supports)
2- Up moves with downward corrections in last hours
3- Whole day actual trading between 9044-9240

Conclusions from intra day chart analysis 

As first 4 hours lower levels consolidation and after that Up moves with downward corrections in last hours therefore decisive up moves will be seen towards following next resistances because 20 Lac crores package was announced by our most respected PM Narenda Modi ji also.;-

1- 9850-9889
2- 9955-10142