Nifty-EOD Chart (11-Oct-2013):-
 |
| Technical Patterns and Formations in EOD charts |
Technical Patterns and Formations in EOD charts
1- All time high formation at 6357.10 on 08-01-2008
2- 1st Lower top formation at 6338.50 on 05-11-2010
3- 2nd Lower top formation at 6229.45 on 20-05-2013
4- 3rd Lower top formation at 6142.50 on 19-09-2013
Conclusions from EOD chart analysis
As 3 times lower top formations since all time high formation in Jan 2008 therefore above mentioned resistances psychological at higher higher levels.
Nifty-EOD Chart (11-Oct-2013):-
 |
| Just click on chart for its enlarged view |
Technical Patterns and Formations in EOD charts
Hanging Man Bearish Candle formation on 11-10-2013
Conclusions from EOD chart analysis
Hanging Man candle means sell off after the market opens during an uptrend. However, by the end of the trading day, the market closes near the top the day. This signifies the potential for further follow up selling in the coming sessions. Trend reversal can be confirmation be by a black candlestick or a large down gap on the next trading day accompanied by a lower close.
Nifty-Intra Day Chart (11-Oct-2013):-
 |
| Just click on chart for its enlarged view |
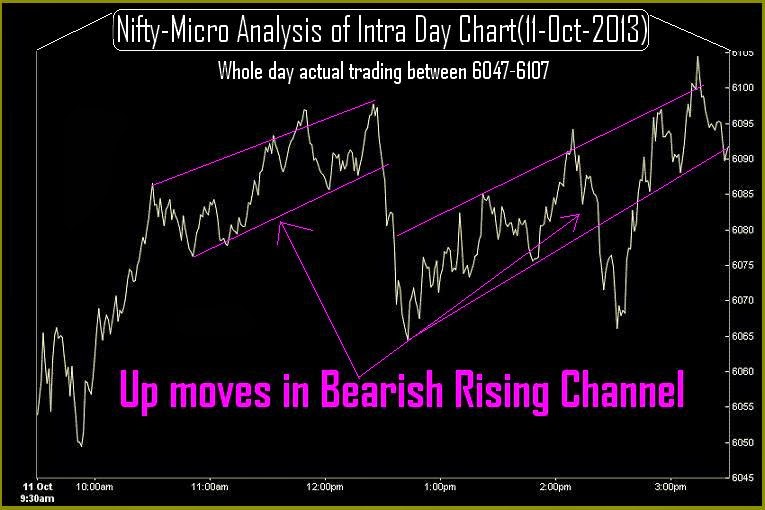
Technical Patterns and Formations in today intraday charts
1- Up moves in Bearish Rising Channel.
3- Whole day actual trading between 6047-6107
Conclusions from intra day chart analysis
As up moves in Bearish Rising Channel therefore therefore emrgence of down moves possibility.
Conclusions (After Putting All Indicators Together)
All trends are up but selling patterns formations on intraday charts and Bearish candle formation also last Friday. As such down moves signals seen just below Falling trend lines from all time high therefore down moves in the beginning of coming week and finally sustaining beyond 5702-6142 will decide next Long Term Trend in the coming week.


.jpg)