Although intraday charts of today are showing selling indications but recovery from lower levels because continuous recovery in Dow's Futures and now trading 52 points up. As selling indications today therefore finally down moves are expected.

ॐ ह्रीं श्रीं लक्ष्मीभयो नमः॥

Technical Analysis and Market Outlook(02-07-2013)
Nifty-Intra Day Chart (01-Jul-2013):-
Technical Patterns and Formations in today intraday charts
1- Consolidation between 5848-5862
2- Mixed Patterns between 5863-5895
3- Whole day up moves in Bearish Rising Channel
4- Whole day actual trading between 5833-5905
Although some supports at lower levels and mixed trading patterns near higher levels but whole day up moves in Bearish rising Channel therefore whole day mixed intraday trading patterns and market will firstly prpare for next moves between yesterday trading range. Upward Wave-B of of 'ABC' correction is on and strong resistance range above yesterday trading range is between 5900-5969. As mixed intraday patterns yesterday and follow up selling today will mean completion of Wave-B and downward Wave-C continuation toward the lowest of Wave-A(5566.25) with possibility of slipping below it also.
Pre-open Outlook(02-07-2013)
US markets closed with almost .50% gains yesterday and Asian markets are mixed therefore sentiment is quiet today morning. As US markets closed after slipping from higher levels therefore cautious approach is required today because European markets may open weak today and resultant sentiment may disturb after its opening. Although Indian markets closed near intraday higher levels but Indian Rupee closed near the lower levels of the day after loosing all intraday gains yesterday therefore sentiment is weak today morning and negative opening is expected in Indian markets today. Follow up selling after mixed intraday patterns yesterday will mean possibility of fresh down moves beginning toward above defined lower levels.
 |
| Just click on chart for its enlarged view |
1- Consolidation between 5848-5862
2- Mixed Patterns between 5863-5895
3- Whole day up moves in Bearish Rising Channel
4- Whole day actual trading between 5833-5905
Conclusions from intra day chart analysis
Although some supports at lower levels and mixed trading patterns near higher levels but whole day up moves in Bearish rising Channel therefore whole day mixed intraday trading patterns and market will firstly prpare for next moves between yesterday trading range. Upward Wave-B of of 'ABC' correction is on and strong resistance range above yesterday trading range is between 5900-5969. As mixed intraday patterns yesterday and follow up selling today will mean completion of Wave-B and downward Wave-C continuation toward the lowest of Wave-A(5566.25) with possibility of slipping below it also.
Pre-open Outlook(02-07-2013)
US markets closed with almost .50% gains yesterday and Asian markets are mixed therefore sentiment is quiet today morning. As US markets closed after slipping from higher levels therefore cautious approach is required today because European markets may open weak today and resultant sentiment may disturb after its opening. Although Indian markets closed near intraday higher levels but Indian Rupee closed near the lower levels of the day after loosing all intraday gains yesterday therefore sentiment is weak today morning and negative opening is expected in Indian markets today. Follow up selling after mixed intraday patterns yesterday will mean possibility of fresh down moves beginning toward above defined lower levels.
It should be kept in mind that Volatility may remain high today and until Nifty will not sustain above 5900/5969 till then next up move will not be considered and follow up selling today will mean fast down moves after confirmation of sustaining below 5848.

FII & DII trading activity in Capital Market Segment on 01-Jul-2013
| ||||||||||||||||
| ||||||||||||||||
Nifty Spot-Levels & Trading Strategy for 02-07-2013
Nifty Spot-Levels
R3 6009
R2 5956
R1 5927
Avg 5874
S1 5845
S2 5792
S3 5763
Nifty Spot-Trading Strategy
H6 5981 Trgt 2
H5 5962 Trgt 1
H4 5943 Long breakout
H3 5920 Go Short
H2 5913
H1 5905
L1 5890
L2 5882
L3 5875 Long
L4 5852 Short Breakout
L5 5833 Trgt 1
L6 5814 Trgt 2
R3 6009
R2 5956
R1 5927
Avg 5874
S1 5845
S2 5792
S3 5763
Nifty Spot-Trading Strategy
H6 5981 Trgt 2
H5 5962 Trgt 1
H4 5943 Long breakout
H3 5920 Go Short
H2 5913
H1 5905
L1 5890
L2 5882
L3 5875 Long
L4 5852 Short Breakout
L5 5833 Trgt 1
L6 5814 Trgt 2
Nifty(Jul Fut)-Levels & Trading Strategy for 02-07-2013
Nifty(Jul Fut)-Levels
R3 5988
R2 5942
R1 5917
Avg 5871
S1 5846
S2 5800
S3 5775
Trading Strategy
H6 5963 Trgt 2
H5 5947 Trgt 1
H4 5931 Long breakout
H3 5911 Go Short
H2 5905
H1 5898
L1 5885
L2 5878
L3 5872 Long
L4 5852 Short Breakout
L5 5836 Trgt 1
L6 5820 Trgt 2
R3 5988
R2 5942
R1 5917
Avg 5871
S1 5846
S2 5800
S3 5775
Trading Strategy
H6 5963 Trgt 2
H5 5947 Trgt 1
H4 5931 Long breakout
H3 5911 Go Short
H2 5905
H1 5898
L1 5885
L2 5878
L3 5872 Long
L4 5852 Short Breakout
L5 5836 Trgt 1
L6 5820 Trgt 2
Bank Nifty(Jul Fut)-Levels & Trading Strategy for 02-07-2013
Bank Nifty(Jul Fut)-Levels
R3 11951
R2 11853
R1 11796
Avg 11698
S1 11641
S2 11543
S3 11486
Bank Nifty(Jul Fut)-Trading Strategy
H6 11895 Trgt 2
H5 11860 Trgt 1
H4 11824 Long breakout
H3 11781 Go Short
H2 11767
H1 11753
L1 11724
L2 11710
L3 11696 Long
L4 11653 Short Breakout
L5 11617 Trgt 1
L6 11582 Trgt 2
R3 11951
R2 11853
R1 11796
Avg 11698
S1 11641
S2 11543
S3 11486
Bank Nifty(Jul Fut)-Trading Strategy
H6 11895 Trgt 2
H5 11860 Trgt 1
H4 11824 Long breakout
H3 11781 Go Short
H2 11767
H1 11753
L1 11724
L2 11710
L3 11696 Long
L4 11653 Short Breakout
L5 11617 Trgt 1
L6 11582 Trgt 2
Finally Next Trend will be decided by 5761
Technical Analysis,Research & Weekly Outlook
(Jul 01 to Jul 05,2013)
 |
| Just click on chart for its enlarged view |
1- 4531.15 on 20-12-2011(Rally beginning after 13 Months correction completion)
2- Wave 1(5629.95 on 22-02-2012)
3- Wave 2(4770.35 on 04-06-2012)
4- Wave 3(6111.80 on 29-01-2013)
5- Wave 4(5477.20 on 10-04-2012)
6- Wave-5(6229.45 on 20-05-2013) and 5 waves correction continuation
7- Recent bottom formation at 5566.25 on 24-06-2013
Nifty-EOD Chart (28-Jun-2013):-
 |
| Just click on chart for its enlarged view |
1- Wave-5 top formation at 6229.45 on 20-05-2013 and 5 waves correction continuation
2- Wave 1(5936.80 on 24-05-2012)
3- Wave 2(6133.75 on 30-05-2012)
4- Wave 3(5683.10 on 13-06-2013)
5- Wave 4(5863.40 on 13-06-2013)
6- Wave-5(5566.25 on 24-06-2013)
7- Strong Pull Back in previous 2 sessions and its high formation at 5852.95 on 28-06-2013.
8- 200 Day EMA(today at 5761)
Conclusions from EOD chart analysis
Strong Pull Back rally in previous 2 sessions and 5 waves correction completion confirmation but it does not mean that correction has been completed which started on 20-05-2013 from 6229.45 because that correction was after completion of 5 Bullish market waves and Nifty has to correct whole up move which started from 4531.15 on 20-12-2011.
It should be kept in mind that Wave-5 completion at 5566.25 on 24-06-2013 may be the completion of correction Wave-A completion and previous 2 sessions may be Wave-B as well as corrective Wave-C possibility is still alive to move below recent low(5566.25)
As Global blasting markets and CCEA approval of gas price hike therefore strong Pull Back rally seen in previous 2 sessions and Nifty closed well above Long Term Trend decider 200-Day EMA. Sustaining it beyond should be firstly watched in the beginning of next week then next Long Term Trend will be considered accordingly.
There should not be hurry for investments because on going correction is after completion of 5 Bullish market waves and much deeper correction may also be seen after confirmation of sustaining below 200-Day EMA(today at 5761).
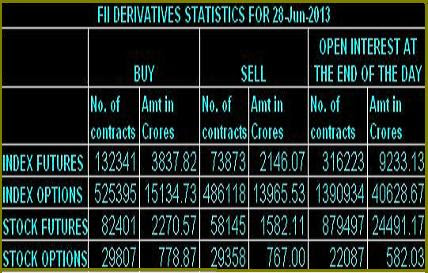
FII & DII trading activity in Capital Market Segment on 28-Jun-2013
| ||||||||||||||||
| ||||||||||||||||
Indian Stock Markets Closing Reports(28-Jun-2013)
Main features of today trading are as follows
RatiosIndex Options Put Call Ratio: 1.06
Total Options Put Call Ratio: 1.01
Nifty P/E Ratio(28-Jun-2013): 17.40
Advances & Declines
BSE Advances : 1,543
BSE Declines : 853
NSE Advances : 1,023
NSE Declines : 382
Nifty Open Interest Changed Today
Nifty- 5700 CE(Jul)- -335,900(-11.75%)
Nifty- 5700 PE(Jul)- 1,646,400(52.41%)
Nifty- 5800 CE(Jul)- -96,550(-2.62%)
Nifty- 5800 PE(Jul)- 1,683,850(99.10%)
Nifty- 5900 CE(Jul)- 773,950(23.61%)
Nifty- 5900 PE(Jul)- 377,750(32.03%)
Nifty- 6000 CE(Jul)- 1,001,950(30.76%)
Nifty- 6000 PE(Jul)- 42,300(2.86%)
Closing
Sensex- closed at 19,395.81(519.86 Points & 2.75%)
Nifty- closed at 5,842.20(159.85 Points & 2.81%)
CNX Midcap - closed at 7,342.40(204.15 Points & 2.86%)
CNX Smallcap- closed at 2,906.85(75.95 Points & 2.68%)
Nifty Spot-Levels & Trading Strategy for 01-07-2013
Nifty Spot-Levels
R3 5982
R2 5917
R1 5879
Avg 5814
S1 5776
S2 5711
S3 5673
Nifty Spot-Trading Strategy
H6 5946 Trgt 2
H5 5922 Trgt 1
H4 5898 Long breakout
H3 5870 Go Short
H2 5860
H1 5851
L1 5832
L2 5823
L3 5813 Long
L4 5785 Short Breakout
L5 5761 Trgt 1
L6 5737 Trgt 2
R3 5982
R2 5917
R1 5879
Avg 5814
S1 5776
S2 5711
S3 5673
Nifty Spot-Trading Strategy
H6 5946 Trgt 2
H5 5922 Trgt 1
H4 5898 Long breakout
H3 5870 Go Short
H2 5860
H1 5851
L1 5832
L2 5823
L3 5813 Long
L4 5785 Short Breakout
L5 5761 Trgt 1
L6 5737 Trgt 2
Nifty(Jul Fut)-Levels & Trading Strategy for 01-07-2013
Nifty(Jul Fut)-Levels
R3 5966
R2 5909
R1 5875
Avg 5818
S1 5784
S2 5727
S3 5693
Nifty(Jul Fut)-Trading Strategy
H6 5933 Trgt 2
H5 5912 Trgt 1
H4 5891 Long breakout
H3 5866 Go Short
H2 5857
H1 5849
L1 5832
L2 5824
L3 5815 Long
L4 5790 Short Breakout
L5 5769 Trgt 1
L6 5748 Trgt 2
R3 5966
R2 5909
R1 5875
Avg 5818
S1 5784
S2 5727
S3 5693
Nifty(Jul Fut)-Trading Strategy
H6 5933 Trgt 2
H5 5912 Trgt 1
H4 5891 Long breakout
H3 5866 Go Short
H2 5857
H1 5849
L1 5832
L2 5824
L3 5815 Long
L4 5790 Short Breakout
L5 5769 Trgt 1
L6 5748 Trgt 2
Bank Nifty(Jul Fut)-Levels & Trading Strategy for 01-07-2013
Bank Nifty(Jul Fut)-Levels
R3 12049
R2 11859
R1 11750
Avg 11560
S1 11451
S2 11261
S3 11152
Bank Nifty(Jul Fut)-Trading Strategy
H6 11947 Trgt 2
H5 11876 Trgt 1
H4 11805 Long breakout
H3 11723 Go Short
H2 11695
H1 11668
L1 11613
L2 11586
L3 11558 Long
L4 11476 Short Breakout
L5 11405 Trgt 1
L6 11334 Trgt 2
R3 12049
R2 11859
R1 11750
Avg 11560
S1 11451
S2 11261
S3 11152
Bank Nifty(Jul Fut)-Trading Strategy
H6 11947 Trgt 2
H5 11876 Trgt 1
H4 11805 Long breakout
H3 11723 Go Short
H2 11695
H1 11668
L1 11613
L2 11586
L3 11558 Long
L4 11476 Short Breakout
L5 11405 Trgt 1
L6 11334 Trgt 2
Nifty Spot-Weekly Levels & Trading Strategy(Jul 01 to Jul 05,2013)
Nifty Spot-Weekly Levels
R3 6226
R2 6039
R1 5940
Avg 5753
S1 5654
S2 5467
S3 5368
Nifty Spot-Weekly Trading Strategy
H6 6142 Trgt 2
H5 6070 Trgt 1
H4 5999 Long breakout
H3 5920 Go Short
H2 5894
H1 5868
L1 5815
L2 5789
L3 5763 Long
L4 5684 Short Breakout
L5 5613 Trgt 1
L6 5541 Trgt 2
R3 6226
R2 6039
R1 5940
Avg 5753
S1 5654
S2 5467
S3 5368
Nifty Spot-Weekly Trading Strategy
H6 6142 Trgt 2
H5 6070 Trgt 1
H4 5999 Long breakout
H3 5920 Go Short
H2 5894
H1 5868
L1 5815
L2 5789
L3 5763 Long
L4 5684 Short Breakout
L5 5613 Trgt 1
L6 5541 Trgt 2
Bank Nifty Spot-Weekly Levels & Trading Strategy(Jul 01 to Jul 05,2013)
Bank Nifty Spot-Weekly Levels
R3 12456
R2 12055
R1 11836
Avg 11435
S1 11216
S2 10815
S3 10596
Bank Nifty Spot-Weekly Trading Strategy
H6 12269 Trgt 2
H5 12113 Trgt 1
H4 11958 Long breakout
H3 11787 Go Short
H2 11730
H1 11673
L1 11560
L2 11503
L3 11446 Long
L4 11276 Short Breakout
L5 11120 Trgt 1
L6 10964 Trgt 2
R3 12456
R2 12055
R1 11836
Avg 11435
S1 11216
S2 10815
S3 10596
Bank Nifty Spot-Weekly Trading Strategy
H6 12269 Trgt 2
H5 12113 Trgt 1
H4 11958 Long breakout
H3 11787 Go Short
H2 11730
H1 11673
L1 11560
L2 11503
L3 11446 Long
L4 11276 Short Breakout
L5 11120 Trgt 1
L6 10964 Trgt 2
Pre-Closing Outlook(28-06-2013)
Nifty trade whole day today above Long Term Trend decider 200-Day EMA(5760) and now traded above next resistance range(5820-5852),sustaining above 5852 will be firstly watched in next week for Long Term Trend turning up confirmation.
Mid-session Outlook-2(28-06-2013)
Nifty is trading above 5800,next trend confirmation levels below and above it are as follows:-
1- Next resistances are between 5820-5852(above it will be rally and Long Term Trend turning up confirmations
2- 200-Day EMA is at 5760(sustaining below it will mean more down moves after Pull Back rally termination.
1- Next resistances are between 5820-5852(above it will be rally and Long Term Trend turning up confirmations
2- 200-Day EMA is at 5760(sustaining below it will mean more down moves after Pull Back rally termination.
Now sustaining beyond 5820-5852 should be watched.
Mid-session Outlook(28-06-2013)
As Global Bullish markets and CCEA approval of gas price hike yesterday therefore strong Indian markets today but price hike decision will be implemented from April 1, 2014. It should be kept in mind that this decision may be reverted also if 3rd front come into power after next General Elections because Communists are opposing it. Only news reaction and Benchmark Indices are more than 1.85% up today,let markets turn quiet and start to trade on technicals then actual trend will be understood because Long Term Trend decider 200-Day EMA is at stake.
Post-open Outlook(28-06-2013)
Nifty slipped below Long Term Trend decider 200-Day EMA after big gap down on 20-06-2013 after Fed Chairman Ben Bernanke announcement that U.S. central bank would slow its bond-buying programme but surprisingly all Global and Indian markets blasted after weaker growth data in US as well as Nifty is trading above 200-Day EMA today. Completely news based highly volatile all Global financial markets but that extreme reaction which is most confusing because we could not understand that how Fed Chairman Ben Bernanke may be so wrong that he will revert his Bond buying decision within 1 week only after 1 weaker weaker growth data.
Either global financial markets manipulation or something else but it is true that Long Term Trend decider 200-Day EMA(5760) has been tested today and Nifty is hovering it around. News based high volatility and firstly sustaining beyond 200-Day EMA(5760) should be watched in the coming sessions and then next trend view should be formed accordingly.
Either global financial markets manipulation or something else but it is true that Long Term Trend decider 200-Day EMA(5760) has been tested today and Nifty is hovering it around. News based high volatility and firstly sustaining beyond 200-Day EMA(5760) should be watched in the coming sessions and then next trend view should be formed accordingly.
Subscribe to:
Posts (Atom)