Although last more than 4 hours trading above 5960 between 5966-6006 with intraday mixed patterns formations today but strong indications of rally continuation in next week after today correction completion also because more indications of consolidation patterns formations today.

ॐ ह्रीं श्रीं लक्ष्मीभयो नमः॥

Pre-Closing Outlook(24-05-2013)
Today is 5th session of correction after previous 27 sessions rally and also completion of 38.2% retracement(5941) today. As 38.2% retracement level lies between next strong support range(5935-5960) therefore this range become most crucial and Nifty again got support within this range today. Last more than 4 hours trading above 5960 between 5966-6006 with intraday mixed patterns formations today therefore valid break out of following ranges should be firstly watched in next week for next trend confirmation:-
1- 5966-6006(1st indication)
2- 5935-6006(correction continuation or completion confirmations)
1- 5966-6006(1st indication)
2- 5935-6006(correction continuation or completion confirmations)
Mid-session Outlook-2(24-05-2013)
As 38.2% Retracement level lies between next strong support range(5935-5960) therefore this range become most crucial and Nifty again got support within this range today as well as trading above 5960 for the last 2 hours with consolidation signals. Sustaining above 5960 will be strong indication of Pull Back Rally and should be firstly watched now.
Mid-session Outlook(24-05-2013)
Live Proofs of our Levels Accuracy
Following Next strong supports range was updated today in Technical Analysis and Market Outlook and yesterday in Mid-session Outlook:-
Next strong supports- 5935-5960
Nifty recovered more 50 points from 5936.80 and now trading above 5987
As Bullish Rising Wedge formations yesterday therefore our view was not bearish today despite more than 75 points down immediately after opening. Pull Back Rally beginning possibility was also told in previous Outlook today and now more than 50 points recovered from lower levels.
Sustaining above 6008 will be the confirmation of minimum a strong Pull Back Rally therefore should be firstly watched now.
Post-open Outlook(24-05-2013)
Fresh up moves immediately after opening today but Nifty lost all more than .70% gains within first 20 minutes and now trading in Red because sharp down moves in some Asian markets. Correction is on but Bullish Rising Wedge formations yesterday and follow up moves today will decide Pull Back Rally beginning or deeper correction.
Next moves deciding levels have already been updated today in Technical Analysis and Market Outlook and should be firstly watched today for confirmations.
Next moves deciding levels have already been updated today in Technical Analysis and Market Outlook and should be firstly watched today for confirmations.
Technical Analysis and Market Outlook(24-05-2013)
Nifty-Intra Day Chart (23-May-2013):-
Technical Patterns and Formations in today intraday charts
1- Sharp down after weak opening.
2- Sideways trading between 5955-6008 in last more than 4 hours.
3- Bullish Rising Wedge formations in last more than 2 hours.
Long and Intermediate Term trends are up and Short Term is down during on going correction.
Sharp down immediately after weak opening and sideways trading between 5955-6008 in last more than 4 hours with Bullish Rising Wedge formations yesterday therefore fresh up moves possibility turned alive and sustaining beyond mentioned trading range will decide following moves:-
1- Above 6008 will mean beginning of minimum Pull Back rally.
2- Below 5955 will mean following 2 levels should be firstly watched for on going correction completion:-
i- 38.2% Retracement level- 5941
ii- Next strong supports- 5935-5960
As 38.2% Retracement level lies between next strong support range therefore this range become most crucial and sustaining it beyond should also be watched for the confirmation of correction completion.
 |
| Just click on chart for its enlarged view |
1- Sharp down after weak opening.
2- Sideways trading between 5955-6008 in last more than 4 hours.
3- Bullish Rising Wedge formations in last more than 2 hours.
Conclusions from intra day chart analysis
Long and Intermediate Term trends are up and Short Term is down during on going correction.
Sharp down immediately after weak opening and sideways trading between 5955-6008 in last more than 4 hours with Bullish Rising Wedge formations yesterday therefore fresh up moves possibility turned alive and sustaining beyond mentioned trading range will decide following moves:-
1- Above 6008 will mean beginning of minimum Pull Back rally.
2- Below 5955 will mean following 2 levels should be firstly watched for on going correction completion:-
i- 38.2% Retracement level- 5941
ii- Next strong supports- 5935-5960
As 38.2% Retracement level lies between next strong support range therefore this range become most crucial and sustaining it beyond should also be watched for the confirmation of correction completion.
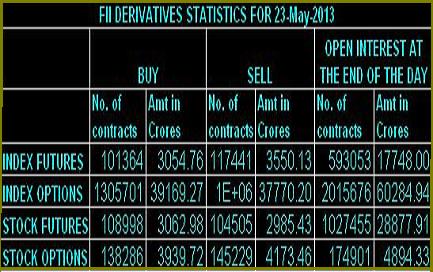
FII & DII trading activity in Capital Market Segment on 23-May-2013
| ||||||||||||||||
| ||||||||||||||||
Indian Stock Markets Closing Reports(23-May-2013)
Main features of today trading are as follows
Index Options Put Call Ratio: 1.17
Total Options Put Call Ratio: 1.11
Nifty P/E Ratio(23-May-2013): 17.71
Advances & Declines
BSE Advances : 596
BSE Declines : 1,734
NSE Advances : 235
NSE Declines : 1,164
Nifty Open Interest Changed Today
Nifty- 5700 CE(May)- -95,050(-8.26%)
Nifty- 5700 PE(May)- 551,000(8.46%)
Nifty- 5800 CE(May)- -91,400(-6.49%)
Nifty- 5800 PE(May)- 1,373,200(25.47%)
Nifty- 5900 CE(May)- 974,050(48.43%)
Nifty- 5900 PE(May)- -1,025,450(-12.37%)
Nifty- 6000 CE(May)- 3,015,700(105.91%)
Nifty- 6000 PE(May)- -1,711,550(-24.11%)
Nifty- 6100 CE(May)- 910,300(15.06%)
Nifty- 6100 PE(May)- -2,663,950(-46.11%)
Nifty- 6200 CE(May)- -1,671,000(-21.38%)
Nifty- 6200 PE(May)- -1,372,000(-43.13%)
Closing
Sensex- closed at 19,674.33(-387.91 Points & -1.93%)
Nifty- closed at 5,967.05(-127.45 Points & -2.09%)
CNX Midcap - closed at 7,802.05(-164.80 Points & -2.07%)
CNX Smallcap- closed at 3,184.80(-95.90 Points & -2.92%)
Nifty Spot-Levels & Trading Strategy for 24-05-2013
Nifty Spot-Levels
R3 6173
R2 6127
R1 6047
Avg 6001
S1 5921
S2 5875
S3 5795
Nifty Spot-Trading Strategy
H6 6093 Trgt 2
H5 6064 Trgt 1
H4 6036 Long breakout
H3 6001 Go Short
H2 5990
H1 5978
L1 5955
L2 5943
L3 5932 Long
L4 5897 Short Breakout
L5 5869 Trgt 1
L6 5840 Trgt 2
R3 6173
R2 6127
R1 6047
Avg 6001
S1 5921
S2 5875
S3 5795
Nifty Spot-Trading Strategy
H6 6093 Trgt 2
H5 6064 Trgt 1
H4 6036 Long breakout
H3 6001 Go Short
H2 5990
H1 5978
L1 5955
L2 5943
L3 5932 Long
L4 5897 Short Breakout
L5 5869 Trgt 1
L6 5840 Trgt 2
Nifty(May Fut)-Levels & Trading Strategy for 24-05-2013
Nifty(May Fut)-Levels
R3 6173
R2 6126
R1 6046
Avg 5999
S1 5919
S2 5872
S3 5792
Nifty(May Fut)-Trading Strategy
H6 6093 Trgt 2
H5 6064 Trgt 1
H4 6035 Long breakout
H3 6000 Go Short
H2 5989
H1 5977
L1 5954
L2 5942
L3 5931 Long
L4 5896 Short Breakout
L5 5867 Trgt 1
L6 5838 Trgt 2
R3 6173
R2 6126
R1 6046
Avg 5999
S1 5919
S2 5872
S3 5792
Nifty(May Fut)-Trading Strategy
H6 6093 Trgt 2
H5 6064 Trgt 1
H4 6035 Long breakout
H3 6000 Go Short
H2 5989
H1 5977
L1 5954
L2 5942
L3 5931 Long
L4 5896 Short Breakout
L5 5867 Trgt 1
L6 5838 Trgt 2
Bank Nifty(May Fut)-Levels & Trading Strategy for 24-05-2013
Bank Nifty(May Fut)-Levels
R3 13158
R2 13024
R1 12808
Avg 12674
S1 12458
S2 12324
S3 12108
Bank Nifty(May Fut)-Trading Strategy
H6 12943 Trgt 2
H5 12863 Trgt 1
H4 12784 Long breakout
H3 12688 Go Short
H2 12656
H1 12624
L1 12559
L2 12527
L3 12495 Long
L4 12399 Short Breakout
L5 12320 Trgt 1
L6 12240 Trgt 2
R3 13158
R2 13024
R1 12808
Avg 12674
S1 12458
S2 12324
S3 12108
Bank Nifty(May Fut)-Trading Strategy
H6 12943 Trgt 2
H5 12863 Trgt 1
H4 12784 Long breakout
H3 12688 Go Short
H2 12656
H1 12624
L1 12559
L2 12527
L3 12495 Long
L4 12399 Short Breakout
L5 12320 Trgt 1
L6 12240 Trgt 2
Mid-session Outlook (23-05-2013)
Firstly sharp down and after that more than 3 hours trading between 5972-6006 with mixed patterns. As Correction continuation therefore firstly break out of above mentioned range and following 2 levels should also be watched for of correction completion if moves below 5972:-
1- 38.2% Retracement level- 5941
2- Next strong supports- 5935-5960
As 38.2% Retracement level lies between next strong support range therefore sustaining beyond above support range should also be watched for the confirmation of correction completion.
1- 38.2% Retracement level- 5941
2- Next strong supports- 5935-5960
As 38.2% Retracement level lies between next strong support range therefore sustaining beyond above support range should also be watched for the confirmation of correction completion.
Mid-session Outlook(22-05-2013)
Although most time trading in positive zone and now trading also in Green but today intraday charts are showing selling patterns therefore correction continuation possibility turned alive.
Mid-session Outlook(21-05-2013)
Following technical view was updated yesterday in Technical Analysis and Market Outlook(21-05-2013):-
Indicators are showing negative divergence in Overbought zone and Short Term correction is very much due but complete selling patterns are required on EOD charts for its beginning. Intraday or very Short term correction can be seen any day in heated yesterday market and it was seen also but let follow up selling develop and Nifty to sustain below next immediate support(6147) then Short Term correction will be considered.
Following guidance was updated today in Post-open Outlook(21-05-2013):-
Nifty is trading below 6147 now and firstly sustaining it beyond should be watched for correction continuation/completion.
Almost 3 hours trading below 6147 with intraday consolidation patterns between 6120-6135 and after that up moves seen above 6147. As today consolidation is just below last Friday consolidation range(6147-6165) therefore a strong signal of correction completion but confirmation will be after sustaining above 6165.
Valid break out of 6120-6165 should be watched now for on going correction continuation/completion confirmation.
Post-open Outlook(21-05-2013)
As slipping below 6147 was expected therefore following conclusive lines were told yesterday;-
1- let follow up selling develop and Nifty to sustain below next immediate support(6147) then Short Term correction will be considered.
2- sustaining beyond 3 Sessions range should be firstly watched today for the beginning of Short Term correction below 6146 or rally continuation above 6229.
1- let follow up selling develop and Nifty to sustain below next immediate support(6147) then Short Term correction will be considered.
2- sustaining beyond 3 Sessions range should be firstly watched today for the beginning of Short Term correction below 6146 or rally continuation above 6229.
Nifty is trading below 6147 now and firstly sustaining it beyond should be watched for correction continuation/completion.
Technical Analysis and Market Outlook(21-05-2013)
Nifty-Intra Day Chart (May 16 to May 20,2013):-
Technical Patterns and Formations in last 3 Sessions intraday charts
1- Selling between 6176-6186 on 16-05-2013
2- Good consolidation between 6147-6165 on 17-05-2013
3- Selling between 6221-6229 on 20-05-2013
4- 3 Sessions actual trading between 6146-6229
As selling developed immediately after opening today therefore following lines were told at:-
1- 11:46 AM- "Selling patterns formations between 6221-6229 today"
2- 12:04 PM- " Next immediate moves preparations will be done between 6147-6229"
Selling was told between 6221-6229 and Nifty could not move above 6229 as well as slipped sharply after our Outlook and Nifty traded whole day within our mentioned trading range(6147-6229) also.
Yesterday lowest was at 6,146.05 and highest at 6,229.45.
Indicators are showing negative divergence in Overbought zone and Short Term correction is very much due but complete selling patterns are required on EOD charts for its beginning. Intraday or very Short term correction can be seen any day in heated yesterday market and it was seen also but let follow up selling develop and Nifty to sustain below next immediate support(6147) then Short Term correction will be considered.
3 Sessions actual trading between 6146-6229 with lower levels good consolidation last Friday and higher levels selling also therefore mixed patterns and sustaining beyond 3 Sessions range should be firstly watched today for the beginning of Short Term correction below 6146 or rally continuation above 6229.
 |
| Just click on chart for its enlarged view |
1- Selling between 6176-6186 on 16-05-2013
2- Good consolidation between 6147-6165 on 17-05-2013
3- Selling between 6221-6229 on 20-05-2013
4- 3 Sessions actual trading between 6146-6229
Conclusions from 3 Sessions intra day chart analysis
As selling developed immediately after opening today therefore following lines were told at:-
1- 11:46 AM- "Selling patterns formations between 6221-6229 today"
2- 12:04 PM- " Next immediate moves preparations will be done between 6147-6229"
Selling was told between 6221-6229 and Nifty could not move above 6229 as well as slipped sharply after our Outlook and Nifty traded whole day within our mentioned trading range(6147-6229) also.
Yesterday lowest was at 6,146.05 and highest at 6,229.45.
Indicators are showing negative divergence in Overbought zone and Short Term correction is very much due but complete selling patterns are required on EOD charts for its beginning. Intraday or very Short term correction can be seen any day in heated yesterday market and it was seen also but let follow up selling develop and Nifty to sustain below next immediate support(6147) then Short Term correction will be considered.
3 Sessions actual trading between 6146-6229 with lower levels good consolidation last Friday and higher levels selling also therefore mixed patterns and sustaining beyond 3 Sessions range should be firstly watched today for the beginning of Short Term correction below 6146 or rally continuation above 6229.

FII & DII trading activity in Capital Market Segment on 20-May-2013
| ||||||||||||||||
| ||||||||||||||||
Subscribe to:
Posts (Atom)