ॐ ह्रीं श्रीं लक्ष्मीभयो नमः॥


 This is the "Oldest & Only Website" of whole World
which is updating Nifty & Indian Stock Markets
"Daily and Weekly accurate Outlooks" 
with "Intraday Charts Analysis"for the 
last more than "14 years" means from "2010"
For its live Proofs just see "Archive"
in the "bottom of this Website".

Trading "calls" from our "Software" with more than "90% accuracy"

Bank Nifty(Nov Fut)-Levels & Trading Strategy for 29-11-2012

Bank Nifty(Nov Fut)-Levels

R3 11936
R2 11811
R1 11743
Avg 11618
S1 11550
S2 11425
S3 11357

Bank Nifty(Nov Fut)-Trading Strategy

H6 11872     Trgt 2
H5 11827     Trgt 1
H4 11782     Long breakout
H3 11729     Go Short
H2 11711
H1 11693
L1 11658
L2 11640
L3 11622     Long
L4 11569     Short Breakout
L5 11524     Trgt 1
L6 11479     Trgt 2

Pre-Closing Outlook(27-11-2012)

As good lower levels consolidation therefore up moves were very much due in Indian markets and Greece package given that trigger today,resultant more than 1.4% rally today. Multiple resistances above 5700 and Nifty is trading above it for the last more than 3 hours but follow up consolidations and sustaining above 5700 is must for next up moves

As Indian markets are sideways within 5549-5815 for the last 42 sessions therefore only short term trend within this range will be considered at present. As last more than 3 hours trading between 5700-5713 without any clear pattern formation therefore valid break out of this range will decide next Short term trend within 42 sessions range and:-

1- Above 5713 will mean up moves after follow up consolidations.
2- Below 5549 will mean retesting of previous week supports near 5600.

Although on going rally continuation is expected but follow up consolidations is must and valid break out of 5700-5713 will also be watched for next decisive short term trend.

Post-open Outlook(27-11-2012)

Although Up moves today but it was clearly projected in last 4 days and following lines were told-

1- In Pre-open Outlook on 27-11-2012:-"fresh up moves above 5700 will be seen now"

2-In Mid-session Outlook on 26-11-2012:- "Nifty will move above 5650 and short term up moves will be seen in the coming sessions"

3-In Bullish Flag formation confirming strong Wave-5 Rally on 24-11-2012:- firstly up moves will be seen in the beginning of next week and Nifty will counter following next resistances:-

1- 5620-5650(Immediate resistance)
2- 5652-5660(Gap created on 15-11-2012)
3- 5672-5705.
4- 5700-5720/5733/5777/5815(Multiple Resistances)

Nifty traded above 5700 today and all above predictions and projections proved true today.

Up moves above 5700 will be seen but strong and multiple resistances between 5700-5815 therefore moves above 5700 may be slow because fresh consolidation will also be required before any up move.

Pre-open Outlook(27-11-2012)

Greece bail out package boosted sentiment today morning and all the Asian markets are positive,some Asian markets are more than 1% up as well. Indian markets will also respond heated mood with positive opening and finally sustaining above immediate resistance range(5620-5650) will mean strength in on going up trend.

As lower levels consolidation seen yesterday after last week good consolidation between 5549-5606 therefore fresh up moves above 5700 will be seen now but strong and multiple resistances between 5700-5815 therefore moves above 5700 may be slow because fresh consolidation will be required before any up move.

Technical Analysis and Market Outlook(27-11-2012)

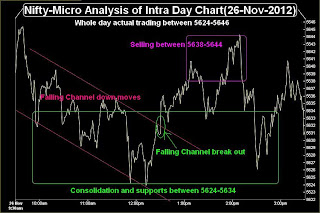
Nifty-Intra Day Chart (26-Nov-2012):-
Just click on chart for its enlarged view
Technical Patterns and Formations in today intraday charts

1- Falling Channel down moves.
2- Falling Channel break out.
3- Consolidation and supports between 5624-5634 
4- Selling between 5638-5644
3- Whole day actual trading between 5624-5646

Conclusions from intra day chart analysis 

Following lines were told in "Bullish Flag formation confirming strong Wave-5 Rally" on 24-11-2012

"As selling between 5620-5650 also therefore follow up consolidation is also required for sustaining above 5650"

Nifty traded whole day today within above mentioned range between 5623.45-5649.20 but with mixed intraday patterns. Although only follow up consolidation was required and it was seen also at lower levels between 5624-5634 but higher levels selling also seen between 5624-5646.

Nifty actual trading within 22 points between 5624-5646 with both buying and selling patterns therefore more technical positions are required for one sided decisive moves. Coming sessions markets may be affected by political news also because 3 consecutive days Parliament adjournments on FDI and if this situation does not resolve early then sentiment may be nervous and fresh selling can not be ruled out.

Follow up buying/selling and sustaining beyond immediate resistance range(5620-5650) will decide next Short Term moves and should be firstly watched in the coming sessions.

FII & DII trading activity in Capital Market Segment on 26-Nov-2012

FII trading activity on NSE and BSE in Capital Julket Segment(In Rs. Crores)
CategoryDateBuy ValueSell ValueNet Value
FII26-Nov-20121546.551383.41163.14

DII trading activity on NSE and BSE in Capital Julket Segment(In Rs. Crores)
CategoryDateBuy ValueSell ValueNet Value
DII26-Nov-2012600.01795.67-195.66

Indian Stock Markets Closing Reports(26-Nov-2012)

Main features of today trading are as follows


1- Benchmark Indices closed in Green with nominal gains.
2- Broad based Midcap and Smallcap Indices closed with good gains.
3- Black Candle formation.

Ratios

Nifty Put Call Ratio: 1.03
Nifty P/E Ratio(26-Nov-2012): 17.64

Advances & Declines

BSE Advances : 1,595
BSE Declines : 1,226
NSE Advances :   837
NSE Declines :   591

Nifty Open Interest Changed Today

Nifty- 5400 CE(Nov)- -40,950(-2.69%)
Nifty- 5400 PE(Nov)- -340,550(-4.72%)

Nifty- 5500 CE(Nov)- -296,350(-20.41%)
Nifty- 5500 PE(Nov)-  261,050(3.10%)

Nifty- 5600 CE(Nov)- -127,250(-2.78%)
Nifty- 5600 PE(Nov)-  1,636,200(22.41%)

Nifty- 5700 CE(Nov)-  483,050(5.51%)
Nifty- 5700 PE(Nov)-  74,850(2.03%)

Closing 

Sensex- closed at 18,537.01(30.44 Points & 0.16%)
Nifty- closed at 5,635.90(9.30 Points & 0.17%)
CNX Midcap - closed at 7,853.50(66.25 Points & 0.85%)
CNX Smallcap- closed at 3,536.00(43.95 Points & 1.26%)

Nifty Spot-Levels & Trading Strategy for 27-11-2012

Nifty Spot-Levels

R3 5674
R2 5661
R1 5648
Avg 5635
S1 5622
S2 5609
S3 5596

Nifty Spot-Trading Strategy

H6 5661     Trgt 2
H5 5655     Trgt 1
H4 5649     Long breakout
H3 5642     Go Short
H2 5639
H1 5637
L1 5632
L2 5630
L3 5627     Long
L4 5620     Short Breakout
L5 5614     Trgt 1
L6 5608     Trgt 2

Nifty(Nov Fut)-Levels & Trading Strategy for 27-11-2012

Nifty(Nov Fut)-Levels

R3 5679
R2 5666
R1 5654
Avg 5641
S1 5629
S2 5616
S3 5604

Nifty(Nov Fut)-Trading Strategy

H6 5667     Trgt 2 
H5 5661     Trgt 1
H4 5655     Long breakout 
H3 5648     Go Short 
H2 5646
H1 5644
L1 5639
L2 5637
L3 5635     Long 
L4 5628     Short Breakout 
L5 5622     Trgt 1 
L6 5616     Trgt 2

Bank Nifty(Nov Fut)-Levels & Trading Strategy for 27-11-2012

Bank Nifty(Nov Fut)-Levels

R3 12120
R2 11827
R1 11641
Avg 11348
S1 11162
S2 10869
S3 10683

Bank Nifty(Nov Fut)-Trading Strategy

H6 11951     Trgt 2 
H5 11834     Trgt 1
H4 11718     Long breakout 
H3 11586     Go Short 
H2 11542
H1 11498
L1 11411
L2 11367
L3 11323     Long 
L4 11191     Short Breakout 
L5 11075     Trgt 1 
L6 10958     Trgt 2

Pre-Closing Outlook(26-11-2012)

Whole day trading between immediate resistance range(5620-5650) today with mixed intraday patterns. Firstly support at lower levels with intraday consolidation patterns as well as small intraday up moves also seen but minor profit booking development at higher levels also therefore next short term trend confirmation will be after valid break out of immediate resistance range(5620-5650).

Mid-session Outlook(26-11-2012)

First 4 hours trading between immediate resistance range(5620-5650) today with intraday consolidation patterns formation therefore expected that Nifty will move above 5650 and short term up moves will be seen in the coming sessions.

Bullish Flag formation confirming strong Wave-5 Rally

Technical Analysis,Research & Weekly Outlook
(Nov26 to Nov 30,2012)
Nifty-EOD Chart (23-Nov-2012):-
Just click on chart for its enlarged view
Technical Patterns and Formations in EOD charts

1- 4531.15 on 20-12-2011(Rally beginning after 13 Months correction completion)
2- Wave-1(5629.95 on 22-02-2012)
3- Wave-2(4770.35 on 04-06-2012)
4- Wave-3(5815.35 on 05-10-2012)
5- Bullish Flag formation in last 41 sessions Wave-4 correction between 5549-5815

Conclusions from EOD chart analysis 

Wave-3 gained 1045 points in 87 sessions and Wave-4 corrected 266 points(25.4%) in 41 sessions(47.1%). Financial markets corrects both time wise and value wise and has sufficiently corrected time wise but value wise correction is small.

Although Wave-4 corrected only 25.4% but time wise sufficient correction of 47.1%. As strong Bullish markets does not slip too much during correction and possibility of impulsive Wave-5 rally is very much alive after time wise correction completion. As corrective Wave-4 is on with Bullish Flag formation therefore strong rally above 5815 can not be ruled out after on going correction completion.

Nifty-EOD Chart (23-Nov-2012):-
Just click on chart for its enlarged view
Technical Patterns and Formations in EOD charts

1- Wave-2 correction completion at 4770.35 on 04-06-2012 and Wave-3 beginning.
2- Wave 3 top formation at 5815.35 on 05-10-2012 and Wave-4 correction continuation for the last 41 sessions.
3- Firstly Wave-4 sideways correction with 24 sessions most time trading between 5639-5733.
4- 1st Break down of sideways trading range after RBI Credit policy on 30-10-2012 and new sideways range low formation at 5583.05 on 31-10-2012.
5- 1st Break out of sideways trading range after  Obama victory in US Predential Elections on 07-11-2012 and new sideways range high formation at 5777.30 on 07-11-2012.
6- 2nd Break down of sideways trading range after Indian Rupee weakening and sharp fall of European markets on 16-11-2012 and new sideways range low formation at 5548.35 on 20-11-2012.

Conclusions from EOD chart analysis 

Firstly sideways trading range(5639-5733) formation and after that its 2 times negative news based without force break down and in the same manner once without force break out also after positive news,resultant Wave-4 correction with Bullish Flag formation.

As corrective Wave-4 is on with Bullish Flag formation therefore strong rally above 5815 can not be ruled out after on going correction completion.

Nifty-Intra Day Chart (Nov 15 to Nov 23,2012):-
Just click on chart for its enlarged view
Technical Patterns and Formations in last 7 Sessions intraday charts

1- Good consolidations between 5549-5606 in 4 sessions of previous week.
2- Minor selling between 5620-5650.
3- Break down of sideways trading range(5583-5777) after Indian Rupee weakening and sudden sharp fall of European markets on 16-11-2012
5- Previous 7 sessions trading between 5549-5650.

Conclusions from 7 Sessions intra day chart analysis 

8 Points gap down on 15-11-2012 and after that new sideways trading range low formation at 5548.35 on 20-11-2012 but good lower levels consolidations between 5549-5606 in 4 sessions of previous week. Although minor selling at higher levels but lower levels good consolidation also therefore up moves are expected. As selling between 5620-5650 also therefore follow up consolidation is also required for sustaining above 5650.

Nifty-Intra Day Chart (23-Nov-2012):-
Just click on chart for its enlarged view
Technical Patterns and Formations in today intraday charts

1- Down moves from 11:00AM after Parliament adjournment on FDI despite first hour consolidation.
2- Consolidation between 5594-5606.
3- Whole day consolidation pattern formations.
4- Whole day actual trading between 5594-5636.

Conclusions from intra day chart analysis 

As whole day intraday consolidation patterns and lower levels supports also after negative news Parliament adjournment on FDI therefore up moves are expected in the beginning of next week.

Conclusions (After Putting All Studies Together)

As on going Wave-4 correction completion possibility after time wise correction completion therefore it is also possible that Wave-4 may not show deeper correction. Bullish Flag formation developed also in last 41 sessions correction and strong Wave-5 rally will be seen after on going Wave-4 correction completion.

Immediate supports are as follows:-

1- 5581-5606.
2- 5549-5566. 

As good intraday consolidation seen last Friday therefore expected that firstly up moves will be seen in the beginning of next week and Nifty will counter following next resistances:-

1- 5620-5650(Immediate resistance)
2- 5652-5660(Gap created on 15-11-2012) 
3- 5672-5705.
4- 5700-5720/5733/5777/5815(Multiple Resistances)

As multiple resistances above last Friday closing(5,626.60) therefore market require complete consolidation for any up move and will take its own complete time to cross and sustain above Wave-3 top(5815) but Bullish Flag formation in last 41 sessions Wave-4 correction therefore finally Wave-5 strong and blasting up moves will be seen without much deeper correction. 

FII & DII trading activity in Capital Market Segment on 23-Nov-2012

FII trading activity on NSE and BSE in Capital Julket Segment(In Rs. Crores)
CategoryDateBuy ValueSell ValueNet Value
FII23-Nov-20121736.161369.79366.37

DII trading activity on NSE and BSE in Capital Julket Segment(In Rs. Crores)
CategoryDateBuy ValueSell ValueNet Value
DII23-Nov-2012532.64716.91-184.27

Indian Stock Markets Closing Reports(23-Nov-2012)

Main features of today trading are as follows

1- Benchmark Indices flat.
2- All the Indices closed with marginal gains or loss.
3- Bullish Hammer Candle formation.

Ratios

Nifty Put Call Ratio: 0.98
Nifty P/E Ratio(23-Nov-2012): 17.60

Advances & Declines

BSE Advances : 1,291
BSE Declines : 1,522
NSE Advances :   624
NSE Declines :   790

Nifty Open Interest Changed Today

Nifty- 5400 CE(Nov)- -52,150(-3.31%)
Nifty- 5400 PE(Nov)- -45,500(-0.62%)

Nifty- 5500 CE(Nov)- -165,150(-10.21%)
Nifty- 5500 PE(Nov)- -518,650(-5.67%)

Nifty- 5600 CE(Nov)- -96,350(-1.99%)
Nifty- 5600 PE(Nov)- -589,100(-7.16%)

Nifty- 5700 CE(Nov)-  973,500(12.01%)
Nifty- 5700 PE(Nov)- -278,500(-7.04%)

Closing 

Sensex- closed at 18,506.57(-10.77 Points & -0.06%)
Nifty- closed at 5,626.60(-1.15 Points & -0.02%)
CNX Midcap - closed at 7,787.25(1.80 Points & 0.02%)
CNX Smallcap- closed at 3,492.05(9.30 Points & 0.27%)

Nifty Spot-Levels & Trading Strategy for 26-11-2012

Nifty Spot-Levels

R3 5688
R2 5662
R1 5644
PIVOT 5618
S1 5600
S2 5574
S3 5556

Nifty Spot-Trading Strategy

H6 5670     Trgt 2 
H5 5660     Trgt 1
H4 5650     Long breakout 
H3 5638     Go Short 
H2 5634
H1 5630
L1 5621
L2 5617
L3 5613     Long 
L4 5601     Short Breakout 
L5 5591     Trgt 1 
L6 5581     Trgt 2

Nifty(Nov Fut)-Levels & Trading Strategy for 26-11-2012

Nifty(Nov Fut)-Levels

R3 5704
R2 5675
R1 5654
PIVOT 5625
S1 5604
S2 5575
S3 5554

Nifty(Nov Fut)-Trading Strategy

H6 5683     Trgt 2 
H5 5671     Trgt 1
H4 5660     Long breakout 
H3 5646     Go Short 
H2 5642
H1 5637
L1 5628
L2 5623
L3 5619     Long 
L4 5605     Short Breakout 
L5 5594     Trgt 1 
L6 5582     Trgt 2

Bank Nifty(Nov Fut)-Levels & Trading Strategy for 26-11-2012

Bank Nifty(Nov Fut)-Levels

R3 11734
R2 11657
R1 11576
PIVOT 11499
S1 11418
S2 11341
S3 11260

Bank Nifty(Nov Fut)-Trading Strategy

H6 11655     Trgt 2 
H5 11618     Trgt 1
H4 11582     Long breakout 
H3 11539     Go Short 
H2 11524
H1 11510
L1 11481
L2 11467
L3 11452     Long 
L4 11409     Short Breakout 
L5 11373     Trgt 1 
L6 11336     Trgt 2

Nifty Spot-Weekly Levels & Trading Strategy(Nov26 to Nov 30,2012)

Nifty Spot-Weekly Levels

R3 5758
R2 5700
R1 5663
PIVOT 5605
S1 5568
S2 5510
S3 5473

Nifty Spot-Weekly Trading Strategy 

H6 5722     Trgt 2 
H5 5700     Trgt 1
H4 5678     Long breakout 
H3 5652     Go Short 
H2 5643
H1 5634
L1 5617
L2 5608
L3 5599     Long 
L4 5573     Short Breakout 
L5 5551     Trgt 1 
L6 5529     Trgt 2

Bank Nifty Spot-Weekly Levels & Trading Strategy(Nov26 to Nov 30,2012)

Bank Nifty Spot-Weekly Levels

R3 11927
R2 11749
R1 11612
PIVOT 11434
S1 11297
S2 11119
S3 10982

Bank Nifty Spot-Weekly Trading Strategy 

H6 11796     Trgt 2
H5 11722     Trgt 1
H4 11648     Long breakout
H3 11561     Go Short
H2 11532
H1 11503
L1 11446
L2 11417
L3 11388     Long
L4 11301     Short Breakout
L5 11227     Trgt 1
L6 11153     Trgt 2

Pre-Closing Outlook(23-11-2012)

As negative news of Parliament adjournment after uproar on FDI therefore slipping below resistance range(5620-5650) and getting support also within immediate next support range(5581-5602). Today down moves are negative news based and without selling patterns therefore breaking down of next support(5581) is must for next down trend confirmation.

1st hour trading between 5621-5633 with intraday consolidation patterns today and this trading range is within next resistance range(5620-5650) therefore next up moves strong indication will be above 5650.

Tight range bound market with immediate supports(5581-5602) and resistances(5620-5650) therefore until 5581-5650 will not decisively break till then next Short Term Trend will not be considered.