ॐ ह्रीं श्रीं लक्ष्मीभयो नमः॥


Trading "calls" from our "Software" with more than "90% accuracy"

 This is the "Oldest & Only Website" of whole World
which is updating Nifty & Indian Stock Markets
"Daily and Weekly accurate Outlooks" 
with "Intraday Charts Analysis"for the 
last more than "14 years" means from "2010"
For its live Proofs just see "Archive"
in the "bottom of this Website".

Nifty(Mar Fut)-Levels & Trading Strategy for 06-03-2012

Nifty(Mar Fut)-Levels

R3 5447
R2 5412
R1 5365
Avg 5330
S1 5283
S2 5248
S3 5201

Nifty(Mar Fut)-Trading Strategy

H6 5400     Trgt 2
H5 5381     Trgt 1
H4 5363     Long breakout
H3 5340     Go Short
H2 5333
H1 5325
L1 5310
L2 5302
L3 5295    Long
L4 5272     Short Breakout
L5 5254     Trgt 1
L6 5235     Trgt 2

Bank Nifty(Mar Fut)-Levels & Trading Strategy for 06-03-2012

Bank Nifty(Mar Fut)-Levels

R3 10717
R2 10605
R1 10423
Avg 10311
S1 10129
S2 10017
S3 9835

Bank Nifty(Mar Fut)-Trading Strategy

H6 10536     Trgt 2
H5 10469     Trgt 1
H4 10402     Long breakout
H3 10321     Go Short
H2 10294
H1 10267
L1 10214
L2 10187
L3 10160     Long
L4 10079     Short Breakout
L5 10012     Trgt 1
L6  9945    Trgt 2

Pre-Closing Outlook(05-03-2012)

Whole day trading below intermediate term trend decider 5340 today with intraday selling patterns today means strong indication of intermediate term trend turning down and high possibility of more down moves to text next support levels.

If anything miraculous come out from tomorrow Assembly results then expect any up move otherwise Indian markets are prepared for more down moves in the coming sessions.

Mid-session Outlook(05-03-2012)


Intraday selling patterns between 5305-5322 today. 

Post-open Outlook(05-03-2012)

All Asian markrets are in Red and some are more than 1% down therefore Red zone trading after weak opening today. Assembly results season today because market is reacting exit poll results today and tomorrow will react on achual results therefore volatility may be high and sustaining it beyond 5298 should be firstly watched for next decisive big move confirmations.

Finally Rally above 5458 after Volatility

Technical Analysis,Research & Weekly Outlook 
(Mar 05 to Mar 09,2012)

Technical Analysis and Research of EOD,weekly and Monthly charts,Micro Analysis of Nifty Intra Day Chart,Technical Positions,next possibilities have already been explained in following topics with 5 Charts therefore not being repeated. Just click following topic links and go through detailed analysis for trading in next week:-

1- Blasing Rally above 5458
2- Crucial Supports in Assembly Election Results Week
3- For Decisive Break out more Preparation within 5298-5458
4- Correction Fate Decider 5340-5415

Conclusions (After Putting All Studies Together)

Long term trend is up,Short term trend is down and fate of next long term moves deciding Intermediate term trend was sideways between 5268-5458 in previous week. All the possibilities regarding break out side direction and supports/resistances have already been discussed in above topics.

It is clear from previous week intraday charts analysis that good supporta at lower levels. Although selling at higher levels but intraday patterns of previous week are suggesting consolidation formations therefore breaking out and sustaining above 5458 is high.

Assembly election results will be declared on 06-03-2012 as well as negative results for Congress will certainly badly hamper sentiment therefore coming sessions may be highly volatile also but until Nifty will not sustain below 5268 till then any decisive down move will not be considered.

Expected that Nifty will not sustain below 5120 and Long term trend will not turn down in worst sentiments also but on the other hand very much expected also that Nifty will not sustain below 5268 and finally rally above 5458 will be seen in the coming week/weeks

Blasting Rally above 5458

It is clear from both previous topics that Indian markets are technically not prepared for any side decisive break out and weekly closing in the center of previous week range after both selling at higher levels and buying at lower levels. Indian markets will prepare in the coming 1/2 sessions for next moves and follow up buying/selling will trigger break out/down.

Rally begun on 20-12-2011 from 4531.15 and correction started from 5629.95 after 1098.80 Nifty Points rally in 45 sessions. Immediate technical positions of this rally are as follows:-

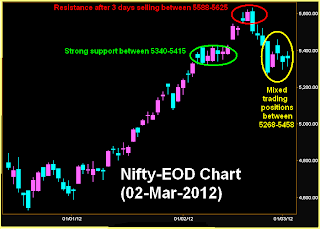
Nifty-EOD Chart(02-Mar-2012):-
Just click on chart for its enlarged view
Conclusions from EOD chart analysis 

1- Resistance after 3 days selling between 5588-5625
2- Strong support between 5340-5415
3- Mixed trading positions between 5268-5458 in previous week.

Only one resistance range above previous week trading range and sustaining above 5458 will be confirmation of correction completion as well as testing of above mentioned resistance range with high possibility of sustaining as well as blasting rally also above 5625 because fresh impulsive wave will develop above 5458 after correction completion.

Crucial Supports in Assembly Election Results Week

Mixed trading positions in previous week 5268-5458 and Assembly election results will be declared on 06-03-2012 as well as negative results for Congress will certainly badly hamper sentiment therefore coming sessions may be highly volatile and follow up selling after any nervous news may result slipping below 5340/5268 also. Keep in mind all following 7 Supports of 2012 Rally with their strength:-

Nifty-EOD Chart(02-Mar-2012):-
Just click on chart for its enlarged view
1- Strong support and base formation between 4532-4670
2- Minor support between 4590-4640
3- Strong support between 4680-4760
4- Support between 4810-4900
5- Minor support between 4992-5068
6- Support between 5120-5190
7- Strong support between 5340-5415

Sustaining below 5340/5268 will mean retracement of 20-Dec-2011 begun rally according to following Fibonacci Retracement Levels(4531-5629):-

Nifty-EOD Chart(02-Mar-2012):-
Just click on chart for its enlarged view
13.0%- 5486
23.6%- 5369
27.0%- 5332
38.2%- 5209
50.0%- 5080
61.8%- 4950
70.7%- 4852
76.4%- 4790
78.6%- 4765
88.6%- 4656

Sustaining below 5340 will mean intermediate term trend turning down and that will mean:-


1- 3 weeks to 3 months down trend and more down moves possibility within this period.
2- Testing possibility of above Supports and Retracement Levels.

Most Important Support Range

Next support range(5120-5190) below 5340 is most important and long term trend decider also because it is containing little above and within it following crucial levels:

1- 38.2% Retracement Level- 5209
2- 55-Day EMA - today at 5192
3- 200-Day EMA- today at 5185
4- 200-Day SMA- today at 5167

Sustaining below 5340 will be first strong indication and sustaining below 5268 will be confirmation of deeper correction also and above mentioned levels will prove most helpful in thst situation.

For Decisive Break out more Preparation within 5298-5458

Nifty-Intra Day Chart(Feb 27 to Mar 01,2012):-
Just click on chart for its enlarged view
Technical Patterns and Formations in last 5 sessions intraday charts

1-Pennant Formation in 5 days intraday chart.
2- Higher Bottoms formations
3- Lower tops formations
4- Panic bottom at 5268 on 27-02-2012
5- Support at 5298
6- Top at 5458
7- Consolidation between 5298-5332
8  Selling between 5422-5458
9- Positive divergence in MACD
10- 5 Days trading between 5268-5458

Conclusions from 5 days intra day chart analysis 

Nifty traded between 5268-5458 and technical positions within this range will decide big moves after the break out of this range because Intermediate term trend decider 5340 is within this range.

Top of 5 days range is at 5458,bottom is at 5268 and weekly closing is at 5359 which is in the centre of both these levels. Selling at higher levels and buying at lower levels is clearly visible in 5 days intraday chart therefore Indian markets are not technically prepared for any side break out and more preparation is required in the coming 1/2 sessions for decisive break out.

Expected that Nifty will firstly trade and prepare for next direction between 5298-5458. 

Correction Fate Decider 5340-5415

Nifty-EOD Chart(02-Mar-2012):-
Just click on chart for its enlarged view
Technical Patterns and Formations in EOD charts

1- Rally above Rising Trendline.
2- 3 Sessions Selling.
3- Correction confirmation after Rising Trendline broken down.
4- Whole week trading near 5340-5415.
5- Weekly Closing at 5359.35 within 5340-5415.

Conclusions from EOD chart analysis 

Correction is on after 3 days selling at the top of rally. Long Tern trend is up,Short term trend is down and Intermediate term trend is sideways.

Sustaining beyond 5340 will decide the fate of Intermediate term trend and its importance has already been told more than 15 times in previous week and Nifty hovered it around whole week also.

Following lines were told on 26-02-2012 in the Weekly Outlook(Feb 27 to Mar 02,2012):-

1- strong supports also between 5340-5415 therefore complete distribution is must for slipping below 5340
2- Indian markets will firstly prepare minimum 2/3 sessions within sideways moves

Indian markets were sideways in previous week and hovered around 5340-5415 as well as closed also at 5359.35 within mentioned range.

Our Previous week projection proved 100% accurate and sustaining beyond 5340-5415 will decide the fate of Intermediate term trend as well as generate big moves towards breaking out direction.

Indian Stock Markets Closing Reports(02-Mar-2012)

Main features of today trading are as follows

1- Bullish Hammer candle formation.
2- Benchmark Indices closed with minor gains.
3- Intraday support at lower levels.

Ratios

Nifty Put Call Ratio: 1.00
Nifty P/E Ratio(02-Mar-2012): 18.99

Advances & Declines

BSE Advances : 1404
BSE Declines : 1505
NSE Advances :  697
NSE Declines :  745

Nifty Open Interest Changed Today

Nifty- 5200 CE(Mar)- -6700(-0.32%)
Nifty- 5200 PE(Mar)- +321500(+4.33%)

Nifty- 5300 CE(Mar)- +8400(+0.41%)
Nifty- 5300 PE(Mar)- +366050(+5.69%)

Nifty- 5400 CE(Mar)- +206500(+6.54%)
Nifty- 5400 PE(Mar)- -43150(-1.17%)

Nifty- 5500 CE(Mar)- +80450(+1.92%)
Nifty- 5500 PE(Mar)- -165250(-5.17%)

Closing 

Nifty- closed at 5,359.35(+19.60 Points & +0.37%)
Sensex- closed at 17,636.80(+52.83 Points & +0.30% )
CNX Midcap - closed at 7,650.95(+12.85 Points & +0.17%)
BSE Smallcap- closed at 6,827.66(-6.19 Points & -0.09%)

FII Trading Data in Derivatives Segment on 02-Mar-2012


FII & DII trading activity in Capital Market Segment on 02-Mar-2012

FII trading activity on NSE and BSE in Capital Julket Segment(In Rs. Crores)
CategoryDateBuy ValueSell ValueNet Value
FII02-Mar-201223951816.35578.65


DII trading activity on NSE and BSE in Capital Julket Segment(In Rs. Crores)
CategoryDateBuy ValueSell ValueNet Value
DII02-Mar-2012994.281064.76-70.48

Nifty Spot-Levels & Trading Strategy for 05-03-2012

Nifty Spot-Levels

R3 5472
R2 5432
R1 5395
Avg 5355
S1 5318
S2 5278
S3 5241

Nifty Spot-Trading Strategy

H6 5436     Trgt 2
H5 5419     Trgt 1
H4 5401     Long breakout
H3 5380     Go Short
H2 5373
H1 5366
L1 5351
L2 5344
L3 5337    Long
L4 5316     Short Breakout
L5 5299     Trgt 1
L6 5281    Trgt 2

Nifty(Mar Fut)-Levels & Trading Strategy for 05-03-2012

Nifty(Mar Fut)-Levels

R3 5522
R2 5480
R1 5435
Avg 5393
S1 5348
S2 5306
S3 5261

Nifty(Mar Fut)-Trading Strategy

H6 5478     Trgt 2
H5 5458     Trgt 1
H4 5438     Long breakout
H3 5414     Go Short
H2 5406
H1 5398
L1 5383
L2 5375
L3 5367     Long
L4 5343     Short Breakout
L5 5323     Trgt 1
L6 5303     Trgt 2

Bank Nifty(Mar Fut)-Levels & Trading Strategy for 05-03-2012

Bank Nifty(Mar Fut)-Levels

R3 11109
R2 10892
R1 10702
Avg 10485
S1 10295
S2 10078
S3 9888

Bank Nifty(Mar Fut)-Trading Strategy

H6 10928     Trgt 2
H5 10832     Trgt 1
H4 10735     Long breakout
H3 10623     Go Short
H2 10586
H1 10549
L1 10474
L2 10437
L3 10400     Long
L4 10288     Short Breakout
L5 10191     Trgt 1
L6 10095     Trgt 2

Pre-Closing Outlook(02-03-2012)

Following line was told in the Weekly Outlook(Feb 27 to Mar 02,2012) on 26-02-2012:-

strong supports also between 5340-5415 therefore complete distribution is must for slipping below 5340.

Importance of 5340 was also told daily in whole of this week and Nifty hovered it around only this level and did not sustain below it also in this week.

We also told today for support at 5298 and Nifty traded whole day above it. Although selling at higher levels in this week but support also at lower levels and Intermediate term trend decider 5340 is intact therefore rally hopes after correction completion near 5340 are very much alive.

Mid-session Outlook-2(02-03-2012)

Following line was told in Mid-session Outlook(02-03-2012)

sustaining above will be strong indication of rally after correction completion.

Nifty moved above 5380 but could not sustain and again slipped below therefore not given correction completion confirmation. Sustaining beyond following ranges should be watched for next moves confirmations:-

1- 5298-5380(Two days range with lower levels good support)(For first indication)
2- 5298-5458(Three days range with lower levels good support and higher levels good selling)(For confirmation)

Cautions approach is also required because market will be volatile and will react Assembly election results also results in next week.

Mid-session Outlook(02-03-2012)

Sentiment was nervous today morning due to the issue of ONGC disinvestment only by LIC therefore market slipped but got support at lower levels today. As today intraday support is above yesterday support therefore yesterday support has strengthened.

Next very short term move confirmations range of 5298-5380 was given within 15 minutes after opening and today trading range at this moment is 5315.05-5378.30. Today intraday charts are showing support at lower levels as well as up moves with consolidation formation therefore finally moves above 5380 is expected and sustaining above will be strong indication of rally after correction completion.

Trading session on Saturday(03-03-2012)

Indian Stock Markets(NSE & BSE) will remain open from 11:00 a.m.( inclusive of Pre-opening )till 12:45 p.m. on  March 3, 2012 on Saturday

Fresh position in MarginPlus in BSE will not be allowed in Saturday Trading session

You can place overnight orders in cash segment and also trade in Futures & Options

Spot facility would be disabled for Saturday trading session

Post-open Outlook(02-03-2012)

Sentiment completely disturbed today due to ONGC issue therefore flat Indian markets today. Good support at lower levels yesterday but lack of confidence due to mentioned news and ONGC is more than 3.45% down immediately after opening.

Sentiment is nervours today morning therefore firstly watch sustaining beyond 5298-5380 for next very short term move confirmations.