ॐ ह्रीं श्रीं लक्ष्मीभयो नमः॥


Trading "calls" from our "Software" with more than "90% accuracy"

 This is the "Oldest & Only Website" of whole World
which is updating Nifty & Indian Stock Markets
"Daily and Weekly accurate Outlooks" 
with "Intraday Charts Analysis"for the 
last more than "14 years" means from "2010"
For its live Proofs just see "Archive"
in the "bottom of this Website".

Nifty(Sep Fut)-Levels & Trading Strategy for 02-09-2011

Nifty(Sep Fut)-Levels

R3 5138
R2 5079
R1 5041
Avg 4982
S1 4944
S2 4885
S3 4847

Nifty(Aug Fut)-Trading Strategy

H6 5101     Trgt 2
H5 5078     Trgt 1
H4 5056     Long breakout
H3 5029     Go Short
H2 5020
H1 5011
L1 4994
L2 4985
L3 4976     Long
L4 4949     Short Breakout
L5 4927     Trgt 1
L6 4904     Trgt 2

Bank Nifty(Sep Fut)-Levels & Trading Strategy for 02-09-2011

Bank Nifty(Sep Fut)-Levels

R3 9819
R2 9687
R1 9604
Avg 9472
S1 9389
S2 9257
S3 9174

Bank Nifty(Aug Fut)-Trading Strategy

H6 9740     Trgt 2
H5 9689     Trgt 1
H4 9639     Long breakout
H3 9580     Go Short
H2 9560
H1 9540
L1 9501
L2 9481
L3 9461     Long
L4 9402     Short Breakout
L5 9352     Trgt 1
L6 9301     Trgt 2

Live Proofs of 100% accurate Predictions of Indian Stock Markets

Six outlooks for Today Indian Markets are live proofs of this fact that only up moves and Bullish markets were told for today and more than 1.55%  Rally was seen today.

Just click following link and anyone can verify above facts anytime on his/her own:-

1- Just watch 4966 and sustaining above means next target at 5120
2- Technical Analysis and Research For 30-08-2011
3- Nifty-Micro Analysis of 7 days Intra Day Chart(Aug 19 to Aug 29,2011)
4- Nifty-Micro Analysis of Intra Day Chart For 30-08-2011
5- Pre-Closing Outlook(29-08-2011)
6- Mid-session Outlook(29-08-2011)


When many others were telling for down moves and profit booking possibility also then we never told only a single word for any type of down move and told only for up moves. 

FII Trading Data in Derivatives Segment on 30-Aug-2011


Nifty-Micro Analysis of Intra Day Chart For 02-09-2011


Nifty-Intra Day Chart(30-Sep-2011):-
Just click on chart for its enlarged view
Technical Patterns and Formations in today intraday charts

1- Whole day Consolidation between 4929-4995
2- Whole day trading between 4929-5014

Conclusions

Whole day consolidation today therefore continuation of on going rally expected in the coming sessions. 

FII & DII trading activity in Capital Market Segment on 30-Aug-2011

FII trading activity on NSE and BSE in Capital Julket Segment(In Rs. Crores)
CategoryDateBuy ValueSell ValueNet Value
FII30-Aug-20112965.582344.68620.9


DII trading activity on NSE and BSE in Capital Julket Segment(In Rs. Crores)
CategoryDateBuy ValueSell ValueNet Value
DII30-Aug-20111283.681181.77101.91

Indian Stock Markets Closing Reports(30-Aug-2011)

Main features of today trading are as follows

1- White Candle.
2- All the Indices closed in Green except FMCG.
3- Whole day intraday consolidation and closing near day's high.

Ratios

Nifty Put Call Ratio: 1.03
Nifty P/E Ratio(30-Aug-2011): 18.05

Advances & Declines

BSE ADVANCES : 1843
BSE DECLINES : 995
NSE ADVANCES : 1057
NSE DECLINES : 376

Nifty Open Interest Changed Today

Nifty- 4900 CE(Aug)- +14500(+0.41%)
Nifty- 4900 PE(Aug)- +1314250(+34.45%)

Nifty- 5000 CE(Aug)- +493850(+9.80%)
Nifty- 5000 PE(Aug)- +416050(+10.10%)

Nifty- 5100 CE(Aug)- +319450(+7.65%)
Nifty- 5100 PE(Aug)- +157700(+12.14%)

Closing 

Nifty- closed at 5,001.00(+81.40 Points & +1.65%)
Sensex- closed at 16,676.75(+260.42 Points & +1.59% )
CNX MIDCAP - closed at 7,294.75(+93.25 Points & +1.29%)
BSE SMALL CAP- closed at 7,131.48(+77.67 Points & +1.10%)

Pre-Closing Outlook(30-08-2011)

When Indian markets were drifting down sharply then following line was told at 10:19:00 AM today:-

"Expected that market will recover finally after intraday consolidation"

As told 100% same happened and Indian markets moved up fast after whole day intraday consolidation and new intraday high also formed at 02:23PM today.

Intraday charts of today are suggesting whole day good consolidation at lower levels and Nifty is sustaining above 5966 also therefore it is pull back rally continuation confirmation.

Most Asian markets intraday charts are showing selling formation today therefore sentiment may be depressed tomorrow morning. As Indian markets are showing consolidation formations today therefore expected that Rally will remain continued in the coming sessions.

Just watch 4966 and sustaining above means next target at 5120

Post-open Outlook(30-08-2011)

Technical Analysis and Research of EOD charts,Micro Analysis of Nifty Intra Day Chart,Technical Positions,next possibilities have already been explained in following topics with 3 Charts therefore not being repeated:-

1- Technical Analysis and Research For 30-08-2011
2- Nifty-Micro Analysis of 7 days Intra Day Chart(Aug 19 to Aug 29,2011)
3- Nifty-Micro Analysis of Intra Day Chart For 30-08-2011

Strong market and today Nifty high is at 4998.05.Bullish views were updated in all the outlooks yesterday and following line was also told at 02:23:00 PM yesterday:-

Next resistance is at 4966 and its testing is possible in the coming sessions.

Pull Back rally is on and sustaining above 5966 today will mean strong rally and testing possibility of next resistance(5120-5220). As all the Indicators have started to recover from oversold zone and positive divergence has also seen therefore 5120 testing is expected in the coming week.

Although market slipped from intraday higher levels but it is intraday correction only because sentiment was boiling and it may be for cooling down of heated sentiment. Expected that market will recover finally after intraday consolidation.

Just watch sustaining above 5966 today for pull back rally continuation confirmation. It is confirm that Nifty sustaining above 5966 will mean positively testing of 5120. 

Technical Analysis and Research For 30-08-2011


Nifty-EOD Chart(29-Aug-2011):-
Just click on chart for its enlarged view
Technical Patterns and Formations in EOD charts

1-7 Days range bound market between 4720-4966
2-Next Resistance between 5120-5220

Conclusions

7 Days range bound market between 4720-4966 with high voltality as well between this range. Mentioned range break out and sustaining above 4966 will be confirmation of strong rally. Next resistance is between 5120-5220 and its testing possibility will be strong after mentioned range break out.

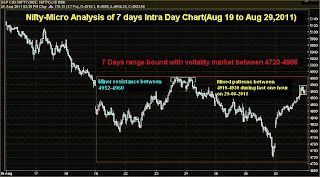
Nifty-Micro Analysis of 7 days Intra Day Chart(Aug 19 to Aug 29,2011)


Nifty-Intra Day Chart(Aug 19 to Aug 29,2011):-
Just click on chart for its enlarged view
Technical Patterns and Formations in last 7 sessions intraday charts

1- Minor resistance between 4952-4960
2- Global cues led high voltality.
2- Mixed patterns between 4910-4930 during last one hour on 29-08-2011

Conclusions

Nifty closed at 4919 on 29-08-2011 and next minor resistance range is 4952-4960. Testing of mentioned resistance range is very much possible today and sustaining anove 4960 is also expected on the back of expected global strong cues.

Nifty-Micro Analysis of Intra Day Chart For 30-08-2011


Nifty-Intra Day Chart(29-Aug-2011):-
Just click on chart for its enlarged view
Technical Patterns and Formations in today intraday charts

1- Up moves in Rising Channel
2- Mixed patterns between 4910-4930 during last one hour
3- Whole day trading between 4910-4934

Conclusions

Strong rally seen in rising channels and no intraday selling seen except last one hour mixed patterns between 4910-4930. As no intraday selling seen therefore continuation of rally expected in the coming sessions.
FII trading activity on NSE and BSE in Capital Julket Segment(In Rs. Crores)
CategoryDateBuy ValueSell ValueNet Value
FII29-Aug-20112211.381845.19366.19


DII trading activity on NSE and BSE in Capital Julket Segment(In Rs. Crores)
CategoryDateBuy ValueSell ValueNet Value
DII29-Aug-2011823.881149.38-325.5

Indian Stock Markets Closing Reports(29-Aug-2011)


Main features of today trading are as follows

1- Long White Candle
2- Strong Global cues triggered rally today.
3- All the Indices closed in Green with good gains.

Ratios

Nifty Put Call Ratio: 1.10
Nifty P/E Ratio(29-Aug-2011): 17.76

Advances & Declines

BSE ADVANCES : 2148
BSE DECLINES : 711
NSE ADVANCES : 1247
NSE DECLINES : 206

Nifty Open Interest Changed Today

Nifty- 4800 CE(Aug)- -475650(-18.80%)
Nifty- 4800 PE(Aug)- +1332150(+27.16%)

Nifty- 4900 CE(Aug)- +247150(+7.30%)
Nifty- 4900 PE(Aug)- +709850(+21.03%)

Nifty- 5000 CE(Aug)- +9850(+0.18%)
Nifty- 5000 PE(Aug)- +108450(+2.66%)

Closing 

Nifty- closed at 4,919.60 (+171.80 Points & +3.62%)
Sensex- closed at 16,416.33(+567.50 Points & +3.58% )
CNX MIDCAP - closed at 7,201.50(+157.50 Points & +2.24%)
BSE SMALL CAP- closed at 7,053.81(+142.45 Points & +2.06%)

Nifty Spot-Levels & Trading Strategy for 30-08-2011

Nifty Spot-Levels

R3 5094
R2 5014
R1 4966
Avg 4886
S1 4838
S2 4758
S3 4710

Nifty Spot-Trading Strategy

H6 5050     Trgt 2
H5 5019     Trgt 1
H4 4989     Long breakout
H3 4954     Go Short
H2 4942
H1 4930
L1 4907
L2 4895
L3 4883    Long
L4 4848     Short Breakout
L5 4818     Trgt 1
L6 4787     Trgt 2

Nifty(Sep Fut)-Levels & Trading Strategy for 30-08-2011

Nifty(Sep Fut)-Levels

R3 5132
R2 5040
R1 4986
Avg 4894
S1 4840
S2 4748
S3 4694

Nifty(Aug Fut)-Trading Strategy

H6 5082     Trgt 2
H5 5048     Trgt 1
H4 5013     Long breakout
H3 4973     Go Short
H2 4959
H1 4946
L1 4919
L2 4906
L3 4892     Long
L4 4852     Short Breakout
L5 4817     Trgt 1
L6 4783     Trgt 2

Bank Nifty(Sep Fut)-Levels & Trading Strategy for 30-08-2011

Bank Nifty(Sep Fut)-Levels

R3 9773
R2 9573
R1 9459
Avg 9259
S1 9145
S2 8945
S3 8831

Bank Nifty(Aug Fut)-Trading Strategy

H6 9668     Trgt 2
H5 9593     Trgt 1
H4 9517     Long breakout
H3 9431     Go Short
H2 9402
H1 9373
L1 9316
L2 9287
L3 9258     Long
L4 9172     Short Breakout
L5 9096     Trgt 1
L6 9021     Trgt 2

Pre-Closing Outlook(29-08-2011)


Positive global cues triggered strong rally in the Indian markets and last resistance range of 6 previous sessions is between 4952-4960.

Pull Back Rally survival today,its continuation and strong rally confirmation will be after crossing of next resistance(4952-4960).

Global markets moves are violent for the last couple of months and huge voltality is being seen. If no big jolt from global markets then continuation of rally expected after crossing of mentioned resistance range.

Mid-session Outlook(29-08-2011)


Crossing of first resistance(4871) was expressed within first hour today in Post-open Outlook and it is Pull back rally survival strong indication. Strong rally and no sign of selling today.

Next resistance is at 4966 and its testing is possible in the coming sessions.

Post-open Outlook(29-08-2011)

Dow'Futures is more than 110 points up today morning and  all the Asian are 1% to 2% up except SSEC therefore good bounce back seen in Indian markets. Sentiment is strong and Nifty is trading between resistance range of 4827-4871. Pull Back Rally started on 19-08-2011 and sustaining above 4871 will be its survival confirmation.

Strong opening and trading today therefore possibility of crossing 4871 can not be rules out.

Blog will be updated after opening of market today. 
Sorry for  inconvenience.