3 Topics for Next week Trading have already been updated and more topics will also be posted before the opening of next Monday markets.

ॐ ह्रीं श्रीं लक्ष्मीभयो नमः॥

Live Proofs of accurate Weekly Analysis and Predictions
321 Points rally in two previous weeks but following headlines of previous weekly Outlooks are live proofs of this fact that we clearly and with full conviction predicted only for Rally and Bullish market well in advance:
1- Bulls Will Welcome In Next Week(Weekly- Jan 07 to Jan 13,2012)
2- Rally Continuation in next week after Consolidations(Weekly- Jan 16 to Jan 20, 2012)
Anyone may click on topic and verify on his/her own
1- Bulls Will Welcome In Next Week(Weekly- Jan 07 to Jan 13,2012)
2- Rally Continuation in next week after Consolidations(Weekly- Jan 16 to Jan 20, 2012)
Anyone may click on topic and verify on his/her own
Firstly Confirmation through Selling Range Break Out
Nifty-Micro Analysis of Intra Day Chart For 23-01-2012
Nifty-Intra Day Chart(20-Jan-2011):-
 |
| Just click on chart for its enlarged view |
1- Selling between 5035-5053
2- Huge volatility in last 75 minutes
3- Whole day trading between 5004-5064
Conclusions from intra day chart analysis
Intraday selling patterns between 5035-5053 therefore until Nifty will not sustain above 5053 till then any up move will not be considered. Sentiment was mixed and highly confusing due to Ril Buy Back news and below expectation results after market therefore huge volatility seen in last 75 minutes. As technical positions reverses sharply during such volatility and new intraday highs as well lows were also formed during this short periood therefore sustaining beyond today intraday range(5004-5064) will be next moves confirmations.
As good intraday selling therefore possibility of slipping below 5004 is also alive but huge volatility therefore firstly sustaining beyond today selling range(5035-5053) should be watched for confirmations.
Survival of Crucial Supports in 14 Months Bear Market
Nifty-EOD Chart(20-Jan-2011):-
 |
| Technical Patterns and Formations in EOD charts |
1- Trend Reversal Broadening Pattern at the bottom of 14 months correction is intact.
2- Trend Reversal 108 Sessions sideways market between 4720-5229 is intact.
3- Begining of rally on 20-12-2011 from 4531.15.
4- Falling Trendline Correction from 5399 and its upward cross over.
Conclusions from EOD chart analysis
Begining of rally on 20-12-2011 from 4531.15 after 14 Months correction and following points are showing indications of this long correction completion:-
1- Two above mentioned trend reversal patterns formations at the bottom of correction. As big 108 sessions patterns therefore its final break out moves will also be vast.
2- On going rally showed good strength after crossing and sustaining above falling Trendline.
3- On going rally commenced in the 13th month of correction and it is a Fibonacci number also therefore whole 14 months correction completion possibility in the 13th month is also alive
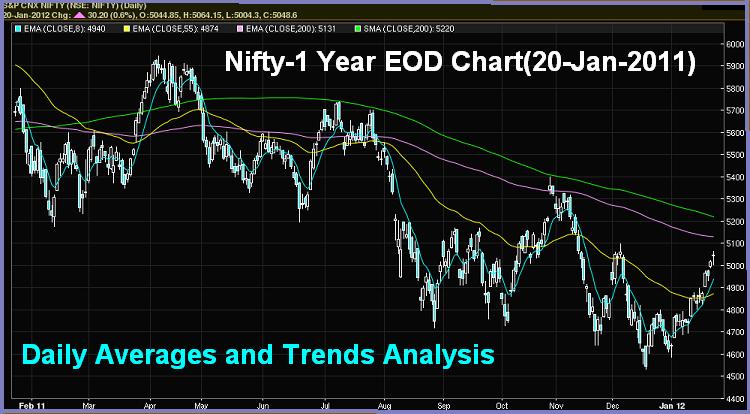
Daily Averages and Trends Analysis
Nifty-1 Year EOD Chart(20-Jan-2011):-
Conclusions
Trends & Averages(EMA-8,21,55,200)- Averages are as follows:
8-Day EMA is at- 4940
55-Day EMA is at- 4874
200-Day EMA is at-5131
200-Day SMA is at-5220
Short term trend is up and Intermediate term trend will be up above 5099. 8-Day EMA is rising as well as showed strength through moving above rising 55-Day EMA. First strong indication of long term trend turning up will be after moving above 200-Day EMA and confirmation will be after sustaining above 200-Day SMA because Nifty got stiff resistance at 200-Day SMA 3 times earlier.
 |
| Just click on chart for its enlarged view |
Trends & Averages(EMA-8,21,55,200)- Averages are as follows:
8-Day EMA is at- 4940
55-Day EMA is at- 4874
200-Day EMA is at-5131
200-Day SMA is at-5220
Short term trend is up and Intermediate term trend will be up above 5099. 8-Day EMA is rising as well as showed strength through moving above rising 55-Day EMA. First strong indication of long term trend turning up will be after moving above 200-Day EMA and confirmation will be after sustaining above 200-Day SMA because Nifty got stiff resistance at 200-Day SMA 3 times earlier.

FII & DII trading activity in Capital Market Segment on 20-Jan-2012
| ||||||||||||||||
| ||||||||||||||||
Indian Stock Markets Closing Reports(20-Jan-2012)
1- Benchmark Indices closed positive with marginal gains.
2 -Hanging Man / Dragonfly Doji Candle Formation.
3- Mixed closing of all sectoral Indices.
Ratios
Nifty Put Call Ratio: 1.23
Nifty P/E Ratio(20-Jan-2012):18.14
Advances & Declines
BSE Advances : 1361
BSE Declines : 1502
NSE Advances : 621
NSE Declines : 813
Nifty Open Interest Changed Today
Nifty- 4900 CE(Jan)- -472350(-14.20%)
Nifty- 4900 PE(Jan)- +635950(+10.12%)
Nifty- 5000 CE(Jan)- -357200(-6.71%)
Nifty- 5000 PE(Jan)- +1905050(+46.37%)
Nifty- 5100 CE(Jan)- -265300(-3.74%)
Nifty- 5100 PE(Jan)- +1367100(+127.15%)
Closing
Nifty- closed at 5,048.60(+30.20 Points & +0.60%)
Sensex- closed at 16,739.01(+95.27 Points & +0.57%)
CNX Midcap - closed at 6,803.15(+57.10 Points & +0.85%)
BSE Smallcap- closed at 6,277.27(+5.04 Points & +0.08%)
Nifty Spot-Levels & Trading Strategy for 23-01-2012
R3 5133
R2 5098
R1 5073
Avg 5038
S1 5013
S2 4978
S3 4953
Nifty Spot-Trading Strategy
H6 5108 Trgt 2
H5 5094 Trgt 1
H4 5081 Long breakout
H3 5064 Go Short
H2 5059
H1 5053
L1 5042
L2 5037
L3 5031 Long
L4 5015 Short Breakout
L5 5001 Trgt 1
L6 4987 Trgt 2
Nifty(Jan Fut)-Levels & Trading Strategy for 23-01-2012
R3 5130
R2 5097
R1 5072
Avg 5039
S1 5014
S2 4981
S3 4956
Nifty(Jan Fut)-Trading Strategy
H6 5105 Trgt 2
H5 5092 Trgt 1
H4 5078 Long breakout
H3 5062 Go Short
H2 5057
H1 5052
L1 5041
L2 5036
L3 5031 Long
L4 5015 Short Breakout
L5 5001 Trgt 1
L6 4988 Trgt 2
Bank Nifty(Jan Fut)-Levels & Trading Strategy for 23-01-2012
R3 9888
R2 9713
R1 9601
Avg 9426
S1 9314
S2 9139
S3 9027
Bank Nifty(Jan Fut)-Trading Strategy
H6 9784 Trgt 2
H5 9716 Trgt 1
H4 9647 Long breakout
H3 9568 Go Short
H2 9542
H1 9516
L1 9463
L2 9437
L3 9411 Long
L4 9332 Short Breakout
L5 9263 Trgt 1
L6 9195 Trgt 2
Nifty Spot-Weekly Levels & Trading Strategy(Jan 23 to Jan 27,2012)
R3 5369
R2 5216
R1 5132
Avg 4979
S1 4895
S2 4742
S3 4658
Nifty Spot-Weekly Trading Strategy
H6 5295 Trgt 2
H5 5237 Trgt 1
H4 5178 Long breakout
H3 5113 Go Short
H2 5091
H1 5069
L1 5026
L2 5004
L3 4982 Long
L4 4917 Short Breakout
L5 4858 Trgt 1
L6 4800 Trgt 2
Bank Nifty Spot-Weekly Levels & Trading Strategy(Jan 23 to Jan 27,2012)
R3 10525
R2 10042
R1 9779
Avg 9296
S1 9033
S2 8550
S3 8287
Bank Nifty Spot-Weekly Trading Strategy
H6 10321 Trgt 2
H5 10123 Trgt 1
H4 9926 Long breakout
H3 9721 Go Short
H2 9652
H1 9584
L1 9447
L2 9379
L3 9310 Long
L4 9105 Short Breakout
L5 8908 Trgt 1
L6 8710 Trgt 2
Nifty-Micro Analysis of Intra Day Chart For 20-01-2012
Nifty-Intra Day Chart(19-Jan-2011):

Technical Patterns and Formations in today intraday charts
1- Support between 4995-5005
2- Mixed Patterns between 5010-5023
3- Whole day trading between 4995-5023
Conclusions from intra day chart analysis
Gap up opening after strong global cues and intraday support at lower levels are showing rally continuation and until Nifty will not slip below 4995 till then any down move will not be considered because intraday consolidation and support above it.
As last more than one hour mixed intraday patterns between 5010-5023 therefore consolidation is required to sustain above it as well testing of next resistance range(5070-5098).
FII & DII trading activity in Capital Market Segment on 19-Jan-2012
| ||||||||||||||||
| ||||||||||||||||
Indian Stock Markets Closing Reports(19-Jan-2012)
1- All the Indices closed in Green except IT and FMCG.
2- Long White Candle.
3- Global cues led strong market after gap up opening.
Ratios
Nifty Put Call Ratio: 1.30
Nifty P/E Ratio(19-Jan-2012): 18.03
Advances & Declines
BSE Advances : 1814
BSE Declines : 990
NSE Advances : 993
NSE Declines : 461
Nifty Open Interest Changed Today
Nifty- 4900 CE(Jan)- -744550(-17.88%)
Nifty- 4900 PE(Jan)- +518600(+8.29%)
Nifty- 5000 CE(Jan)- -911150(-13.77%)
Nifty- 5000 PE(Jan)- +1653150(+63.76%)
Nifty- 5100 CE(Jan)- -228550(-3.09%)
Nifty- 5100 PE(Jan)- +316850(+37.40%)
Closing
Nifty- closed at 5,018.40(+62.60 Points & +1.26%)
Sensex- closed at 16,643.74(+192.27 Points & +1.17% )
CNX Midcap - closed at 6,746.05(+98.55 Points & +1.48%)
BSE Smallcap- closed at 6,272.23(+76.53 Points & +1.24%)
Nifty Spot-Levels & Trading Strategy for 20-01-2012
R3 5062
R2 5042
R1 5030
Avg 5010
S1 4998
S2 4978
S3 4966
Nifty Spot-Trading Strategy
H6 5050 Trgt 2
H5 5042 Trgt 1
H4 5035 Long breakout
H3 5026 Go Short
H2 5023
H1 5020
L1 5015
L2 5012
L3 5009 Long
L4 5000 Short Breakout
L5 4993 Trgt 1
L6 4985 Trgt 2
Nifty(Jan Fut)-Levels & Trading Strategy for 20-01-2012
R3 5071
R2 5049
R1 5035
Avg 5013
S1 4999
S2 4977
S3 4963
Nifty(Jan Fut)-Trading Strategy
H6 5058 Trgt 2
H5 5050 Trgt 1
H4 5041 Long breakout
H3 5031 Go Short
H2 5028
H1 5025
L1 5018
L2 5015
L3 5012 Long
L4 5002 Short Breakout
L5 4993 Trgt 1
L6 4985 Trgt 2
Bank Nifty(Jan Fut)-Levels & Trading Strategy for 20-01-2012
R3 9366
R2 9291
R1 9246
Avg 9171
S1 9126
S2 9051
S3 9006
Bank Nifty(Jan Fut)-Trading Strategy
H6 9322 Trgt 2
H5 9294 Trgt 1
H4 9267 Long breakout
H3 9234 Go Short
H2 9223
H1 9212
L1 9190
L2 9179
L3 9168 Long
L4 9135 Short Breakout
L5 9107 Trgt 1
L6 9079 Trgt 2
Subscribe to:
Posts (Atom)