Short Term upward moves beginning
possibility amid forceful
correction continuation
Technical Analysis,Research & Weekly Outlook
(Mar 03 to Mar 07,2025)
Nifty-EOD Chart Analysis
(Waves structure)
Nifty-EOD Chart (28-Feb-2025):-

Technical Patterns and Formations in EOD charts
1- Corrective Wave-C of previous Waves structure "ABC correction" completion at 15183.40 on 17-06-2022 and Impulsive Wave-1 of new Waves structure beginning.
2- Impulsive Wave-1 completion at 18887.60 on 01-12-2022.
3- Corrective Wave-2 completion at 16828.30 on 20-03-2023.
4- Impulsive Wave-(i) of Wave-3 completion at 20222.45 on 15-09-2023 and Wave-A of "ABC" correction beginning.
5- Wave-A of Wave-(ii) of Wave-3 completion at 19333.60 on 04-10-2023.
6- Wave-B of Wave-(ii) of Wave-3 completion at 19849.80 on 17-10-2023.
7- Wave-C of Wave-(ii) of Wave-3 completion at 18837.80 on 26-10-2023 and impulsive Wave-(iii) of Wave-3 beginning.
8- Impulsive Wave-(iii) of Wave-3 completion with new life time top formations at 26277.30 on 27-09-2024 and Corrective Wave-A of Wave-(iv) of Wave-3 of "ABC" correction beginning.
9- Corrective Wave-A of Wave-(iv) of Wave-3 completion at 23263.20 on 21-11-2024.
10- Corrective Wave-B of Wave-(iv) of Wave-3 completion at 24857.80 on 05-12-2024.
11- Corrective Wave-C of Wave-(iv) of Wave-3 continuation with recent bottom formations at 22104.60 on 28-02-2025.
Conclusions from EOD chart analysis
(Waves structure)
Impulsive Wave-1 of new Waves structure begun from 18887.60 on 01-12-2022 after Corrective Wave-C of "ABC correction" of previous Waves structure completion at this level and from this level corrective Wave-2 started which completed at 16828.30 on 20-03-2023 and impulsive Wave-3 begun from this level.
Impulsive Wave-(i) of Wave-3 completed at 20222.40 on 15-09-20235 and from this level corrective Wave-A of "ABC" correction of Wave-(ii) of Wave-3 started which completed at 19333.60 on 04-10-2023. Wave-B begun from this level which completed at 19849.80 on 17-10-2023 and Wave-C started which completed at 18837.80 on 26-10-2023. Impulsive Wave-(iii) of Wave-3 begun from this level which completed with new life time top formations at 26277.30 on 27-09-2024 and corrective Wave-A of Wave-(iv) of Wave-3 started from this level.
Corrective Wave-A of Wave-(iv) of Wave-3 completed at 23263.20 on 21-11-2024 and Wave-B of Wave-(iv) of Wave-3 begun from this levels which completed at 24792.30 on 13-12-2024 and from this levels corrective Wave-C of Wave-(iv) of Wave-3 started which is now in continuation with recent bottom formations at 22104.60 on 28-02-2025 and no indication of its completion yet on EOD charts.
Nifty-EOD Chart Analysis
(Stochastic & MACD)
Nifty-EOD Chart (28-Feb-2025):-

Technical Patterns and Formations in EOD charts
1- Stochastic- %K(5) line has intersected %D(3) line downward and its both lines are falling in Over sold zone.
2- Stochastic:- %K(5)- 5.54 & %D(3)- 8.32.
3- In MACD- MACD line has intersected Average line downward and its both lines are falling in negative zone.
4- MACD(26,12)- -385.44 & EXP(9)- -206.83 & Divergence- -178.61
Conclusions from EOD chart analysis
(Stochastic & MACD)
Technical positions of Short Term indicators are as follows:-
1- As in Short Term indicator Stochastic its %K(5) line has intersected %D(3) line downward and its both lines are falling in Over sold zone and have turned completely Oversold also therefore it will be understood that this indicator is showing first signal of Short Term upward moves beginning. Let its both lines to move above Oversold zone after %K(5) line upward intersection of %D(3) line then Short Term Upward moves/Pull Back Rally will be seen.
2- As in MACD indicator its MACD line has intersected Average line downward and its both lines are falling in negative zone therefore it will be understood that this indicator is confirming downward trend formations and resultant on going downward moves continuation expectations.
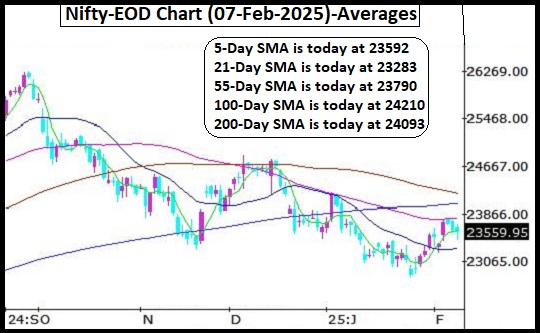
Nifty-EOD Chart Analysis
(Averages)
Nifty-EOD Chart (28-Feb-2025):-

Technical Patterns and Formations in EOD charts
Averages:-
1- 5-Day SMA is today at 22513
2- 21-Day SMA is today at 23082
3- 55-Day SMA is today at 23390
4- 100-Day SMA is today at 23822
5- 200-Day SMA is today at 24073
Conclusions from EOD chart analysis
(Averages)
As all the lower term SMAs are below its higher Averages and all the SMAs are in falling mode except 200-Day SMA as well as Nifty closed below all the Averages last Friday therefore it will be understood that all the Trends are now down and correction continuation in its full force.
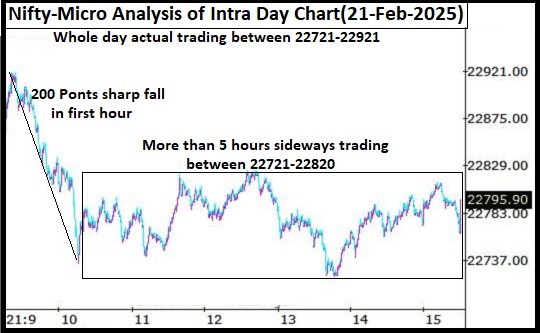
Nifty-Intra Day Chart Analysis
(28-Feb-2025)
Nifty-Intra Day Chart (28-Feb-2025):-

Technical Patterns formation in today intraday charts
1- 215 Points down in first hour after 75 points gap down opening
2- Down moves in Bullish Falling Channel between 22216-22297
3- Support between 22105-22149
4- Whole day actual trading between 22105-22450
Conclusions from intra day chart analysis
As all the Global markets were in crashing mode last Friday therefore 215 Points downward moves were seen in first hour after 75 points gap down opening. After that firstly Down moves in Bullish Falling Channel between 22216-22297 and then lower levels support also in the last more than 2 hours therefore upward moves are expected towards 22216 in the beginning of next week. Sustaining beyond 22216-22297 should be finally watched for next Short Term moves beginning confirmations.
Conclusions (After putting
all studies together)
1- Long Term Trend is down.
2- Intermediate Term trend is down.
3- Short Term Trend is down.
Impulsive Wave-(iii) of Wave-3 completed at 26277.30 on 27-09-2024 and from this level corrective Wave-A of "ABC" correction of Wave-(iv) of Wave-3 started. All the Tends have turned down during this correction which is now in continuation through corrective Wave-C of Wave-(iv) with recent bottom formations at 22104.60 on 28-02-2025 after loosing 4172.7 points in the last 5 months.
All the Averages and MACD indicator are confirming downward Trend formations. As Short Term indicator Stochastic is signalling Short Term upward moves beginning possibility and last Friday intraday charts patterns are also suggesting that upward moves possibility in beginning of coming week Short Term upward moves are expected towards following next resistances in the coming week
1- 22451-22508(Gap resistance)
2- 22533-22556
3- 22571-22619
4- 22894-22923
5- 23020-23085
6- 23178-23235
7- 23284-23348
8- 23577-23681
9- 23745-23807
Next supports below last Friday closing are as follows:-
1- 22055-22106
2- 21884-22191
3- 21502-21582
4- 21417-21500