ॐ ह्रीं श्रीं लक्ष्मीभयो नमः॥


Trading "calls" from our "Software" with more than "90% accuracy"

More than "12 years" old "only site of whole world" 
with more than "9700 accurate Outlooks" of 
"Indian Stock Markets" 

Mid-session Outlook-3(01-02-2012)

Down after intraday selling at higher levels but minor support at lower levels also seen after formation of new intraday trading low therefore mixed intraday trading patterns today.

Market is preparing for next moves within sideways moves and sustaining beyond today trading range(5160-5190) will be give next moves first strong indication therefore should be firstly watched.

Mid-session Outlook-2(01-02-2012)

Selling confirmations at higher levels therefore down moves possibility turns higher.

Mid-session Outlook(01-02-2012)

Following lines were told in Blasting Rally after sustaining above 5229

"expected that Nifty will firstly trade between 5150-5217 and prepare for next moves and follow up buying/selling within this range will give next moves first indication and sustaining it beyond will be confirmations"

Above lines should be kept in mind for final confirmation and first indication will be after sustaining beyond today achual trading range(5168-5190) and Nifty is preparing for next moves within it for the last 3 hours.

Blasting Rally after sustaining above 5229

Technical Analysis,Researches & Market Outlook
(01-02-2012)

Nifty-EOD Chart(31-Jan-2012):-
Just click on chart for its enlarged view
Technical Patterns and Formations in EOD charts

1- Rally is continued above rising trend line.
2- Rally closing near its top yesterday.
3- Nifty near the top of Trend Reversal 120 Sessions sideways market between 4720-5229.
4- Trend Reversal Broadening Pattern at the bottom of 14 months correction and it has also given strong support at lower levels to long term correction.

Conclusions from EOD chart analysis 

Nifty above 5200 yesterday but when Nifty was below 4600 since then we projected rally and up moves more than 75 times as well as showed our full confidence in Bullish formations in above EOD Chart as well as we updated following conclusions:

More than 14 months long term correction and at its bottom huge 120 sessions above mentioned two trend reversal formations and they have complete strength to reverse whole long term correction.

Today anyone can say for rally but only we told non stop daily for that Rally which was seen in January 2012. When we told for correction of this rally then also it was seen on 30-01-2012

Nifty-Micro Analysis of 5 days Intra Day Chart
(Jan 24 to Jan 31,2012)

Nifty-Intra Day Chart(Jan 24 to Jan 31,2012):-
Just click on chart for its enlarged view
Technical Patterns and Formations in last 5 sessions intraday charts

1- Condolidation between 5050-5155 is last 5 days
2- Selling Formations also at higher levels.
3- Mixed Patterns between 5150-5160
4- 5 Sessions trading between 5050-5217.

Conclusions from 5 days intra day chart analysis 

Resistances were as follows;-

1- 5070-5098
2- 5130-5225
3- 5260-5310
4- 5340-5375

Nifty has almost covered above mentioned first 2 resistances in last 5 sessions rally with lower levels good support but higher levels selling also within it.

Conclusions (After Putting All Studies Together)

Crucial Averages are as follows:

200-Day EMA is at-5131
200-Day SMA is at-5198(Nifty faced stiff resistance 3 times earlier)

We told only for very short term correction and it was seen on Monday and Rally is on after yesterday sharp surge. As higher levels selling in last 5 days and mixed intraday patterns also seen yesterday despite fast up moves above that therefore more consolidations are required for sustaining above the top(5217) of last 5 sessions.

Sustaining above 5217/5229 will mean blast rally after:-

1- Clearing of 3 times resistance(200-Day SMA)
2- Break out of 120 sessions trading range.

Since long telling only for strong rally above 5229 after break out and its possibility is high also but short term indicators are over bought and higher levels selling also in last 5 sessions therefore more consolidation as well as cooling down of indicators are firstly required in the coming sessions.

Expected that finally strong rally will be seen above 5229 but selling above 5150 in last 5 sessions therefore expected that Nifty will firstly trade between 5150-5217 and prepare for next moves and follow up buying/selling within this range will give next moves first indication and sustaining it beyond will be confirmations.

1- Above 5217 will mean strong rally after break out
2- Below 5150 will mean firstly short term correction and then rally after its completion.
3- Correction is completed in sideways in Bull markets therefore this possibility will also be kept in mind.

FII Trading Data in Derivatives Segment on 31-Jan-2012


FII & DII trading activity in Capital Market Segment on 31-Jan-2012

FII trading activity on NSE and BSE in Capital Julket Segment(In Rs. Crores)
CategoryDateBuy ValueSell ValueNet Value
FII31-Jan-20123460.782836.68624.1


DII trading activity on NSE and BSE in Capital Julket Segment(In Rs. Crores)
CategoryDateBuy ValueSell ValueNet Value
DII31-Jan-20121299.941541.2-241.26

Indian Stock Markets Closing Reports(31-Jan-2012)

Main features of today trading are as follows

1- Long White Candle
2- All the Indices closed in Green.
3- Closing near the higher levels of the day after strong recovery.

Ratios

Nifty Put Call Ratio: 0.93
Nifty P/E Ratio(31-Jan-2012): 18.53

Advances & Declines

BSE Advances : 1821
BSE Declines : 1031
NSE Advances : 1028
NSE Declines : 416

Nifty Open Interest Changed Today

Nifty- 5000 CE(Jan)- -82950(-3.56%)
Nifty- 5000 PE(Jan)- +969550(+20.65%)

Nifty- 5100 CE(Jan)- -306200(-11.21%)
Nifty- 5100 PE(Jan)- +1218550(+32.79%)

Nifty- 5200 CE(Jan)- -119300(-2.48%)
Nifty- 5200 PE(Jan)- +1315650(+73.35%)

Closing

Nifty- closed at 5,199.25(+111.95 Points & +2.20%)
Sensex- closed at 17,193.55(+330.25 Points & +1.96% )
CNX Midcap - closed at 7,100.55(+160.80 Points & +2.32%)
BSE Smallcap- closed at 6,463.30(+89.71 Points & +1.41%)

Nifty Spot-Levels & Trading Strategy for 01-02-2012

Nifty Spot-Levels

R3 5331
R2 5273
R1 5236
Avg 5178
S1 5141
S2 5083
S3 5046

Nifty Spot-Trading Strategy

H6 5295     Trgt 2
H5 5273     Trgt 1
H4 5251     Long breakout
H3 5225     Go Short
H2 5216
H1 5207
L1 5190
L2 5181
L3 5172     Long
L4 5146     Short Breakout
L5 5124     Trgt 1
L6 5102     Trgt 2

Nifty(Feb Fut)-Levels & Trading Strategy for 01-02-2012


Nifty(Feb Fut)-Levels

R3 5365
R2 5299
R1 5261
Avg 5195
S1 5157
S2 5091
S3 5053

Nifty(Feb Fut)-Trading Strategy

H6 5328     Trgt 2
H5 5304     Trgt 1
H4 5280     Long breakout
H3 5251     Go Short
H2 5242
H1 5232
L1 5213
L2 5203
L3 5194     Long
L4 5165     Short Breakout
L5 5141     Trgt 1
L6 5117     Trgt 2

Bank Nifty(Feb Fut)-Levels & Trading Strategy for 01-02-2012

Bank Nifty(Feb Fut)-Levels

R3 10444
R2 10212
R1 10082
Avg 9850
S1 9720
S2 9488
S3 9358

Bank Nifty(Feb Fut)-Trading Strategy

H6 10326     Trgt 2
H5 10238     Trgt 1
H4 10151     Long breakout
H3 10051     Go Short
H2 10018
H1 9985
L1 9918
L2 9885
L3 9852     Long
L4 9752     Short Breakout
L5 9665     Trgt 1
L6 9577     Trgt 2

Pre-Closing Outlook(31-01-2012)

Only very short term correction was expected and it has been seen yesterday. First 5 hours intraday trading between 5130-5164 and after that and its break out is indicating strong rally after yesterday correction and today consolidation. Next resistance is between 5200-5210 and its crossing will be fresh phase of strong rally confirmation as well as its possibility can not be ruled out after today lower levels good consolidations..

Post-open Outlook(31-01-2012)

Positive global cues led strong Indian markets trading between 200-Day EMA(5130) and 200-Day SMA(5201). Sustaining beyond these two averages will give following
conclusions:-

1-  Sustaining above 200-Day SMA(5201) will mean continuation of correction.worst is over after Long term trend turning up.
2-  Sustaining below 200-Day EMA(5130) will mean continuation of yesterday begun correction.

Strong market today and above two averages will give confirmation to Long term trend therefore 5130-5201 must be watched for long term positions and investment decisions.

Pre-open Outlook(31-01-2012)

Although European markets closed in Red yesterday but US markets closed flat after good recovery from intraday lower levels as well as its futures are also positive(Dow is +37) therefore Asian markets are flat to positive and sentiment is good today morning. Indian markets will open positive after pleasantly maintained sentiment and Nifty will firstly hover around 5100 and will prepare for next moves after yesterday very short term expected correction ae well as sustaining it beyond will be first indication of next moves

Follow up buying/selling today morning and sustaining beyond 5100 will give next moves first indication therefore should be firstly watched today.

Correction Life Decider 5000-5050

Nifty-Micro Analysis of Intra Day Chart For 31-01-2012

Nifty-Intra Day Chart(30-Jan-2012):-
Just click on chart for its enlarged view
Technical Patterns and Formations in today intraday charts


1- Selling between 5147-5165
2- Whole day down moves in falling channel
3- Whole day trading between 5077-5165


Conclusions from intra day chart analysis

Very Short Term correction was told in following topics during last 3 days and sustaining below 5120 possibility was also told during trading hours. All that which was told for today market proved 100% accurate during trading hours:-

1- Very Short Term Correction is Due
2- Rally after very short term correction

Correction was due and it was seen today.Good support between 5000-5050,its testing possibility can not be ruled out as well as this range will be firstly watched for the life of on going correction.

As Nifty moved down and closed below last 3 sessions range more down moves possibility can not be ruled out as well as sustaining beyond mentioned support will be firstly watched for next moves confirmations.

Just Watch 5000-5050 for correction completion/continuation confirmations.

Indian Stock Markets Closing Reports(30-Jan-2012)

Main features of today trading are as follows

1 Long Black Candle
2- All the Indices closed in Red.
3- Closing near the lowest of the day.

Ratios

Nifty Put Call Ratio: 1.12
Nifty P/E Ratio(30-Jan-2012): 18.13


Advances & Declines

BSE Advances : 1015
BSE Declines : 1820
NSE Advances : 397
NSE Declines : 1062

Nifty Open Interest Changed Today

Nifty- 5000 CE(Jan)- -17150(-0.73%)
Nifty- 5000 PE(Jan)- -53000(-1.05%)

Nifty- 5100 CE(Jan)- +248500(+10.01%)
Nifty- 5100 PE(Jan)- -170600(-4.28%)

Nifty- 5200 CE(Jan)- +656650(+14.76%)
Nifty- 5200 PE(Jan)- -612400(-24.92%)

Closing

Nifty- closed at 5,087.30(-117.40 Points & -2.26%)
Sensex- closed at 16,863.30(-370.68 Points & -2.15% )
CNX Midcap - closed at 6,939.75(-149.90 Points & -2.11%)
BSE Smallcap- closed at 6,373.59(-118.10 Points & -1.82%)

Nifty Spot-Levels & Trading Strategy for 31-01-2012

Nifty Spot-Levels

R3 5233
R2 5199
R1 5143
Avg 5109
S1 5053
S2 5019
S3 4963

Nifty Spot-Trading Strategy

H6 5177     Trgt 2
H5 5156     Trgt 1
H4 5136     Long breakout
H3 5111     Go Short
H2 5103
H1 5095
L1 5078
L2 5070
L3 5062     Long
L4 5037     Short Breakout
L5 5017     Trgt 1
L6 4996     Trgt 2

Nifty(Jan Fut)-Levels & Trading Strategy for 31-01-2012

Nifty(Jan Fut)-Levels

R3 5256
R2 5223
R1 5167
Avg 5134
S1 5078
S2 5045
S3 4989

Nifty(Jan Fut)-Trading Strategy

H6 5201     Trgt 2
H5 5181     Trgt 1
H4 5160     Long breakout
H3 5136     Go Short
H2 5128
H1 5120
L1 5103
L2 5095
L3 5087     Long
L4 5063     Short Breakout
L5 5042     Trgt 1
L6 5022     Trgt 2

Bank Nifty(Jan Fut)-Levels & Trading Strategy for 31-01-2012

Bank Nifty(Jan Fut)-Levels

R3 9896
R2 9818
R1 9683
Avg 9605
S1 9470
S2 9392
S3 9257

Bank Nifty(Jan Fut)-Trading Strategy

H6 9762     Trgt 2
H5 9714     Trgt 1
H4 9666     Long breakout
H3 9607     Go Short
H2 9588
H1 9568
L1 9529
L2 9509
L3 9490     Long
L4 9431     Short Breakout
L5 9383     Trgt 1
L6 9335     Trgt 2

Pre-Closing Outlook(30-01-2012)

Very Short Term Correction was told again and again and following projection was also updated in Mid-session Outlook(30-01-2012) today:

Sustaining below 5120 is expected

Nifty slipped below 5120 and low at 5080.00 has been formed today. Correction is on and levels near 5050 will be watched now.

Mid-session Outlook(30-01-2012)

Very short term correction was very much due and it was clearly told also as well as being seen today. Support of 5120 has been tested and next support below it at 5050..

Intraday patterns are showing selling at higher levels and sustaining below 5120 will mean 5050 fast.

Very short term correction was expected and it has been seen today. Follow up buying/selling within 5120-5130 in the next couple of hours as well as Sustaining it beyond wiil give confirmation of continuation or completion of today begun correction.

Sustaining below 5120 is expected and sustaining beyond 5120-5130 will be firstly watched for next moves confirmations.

Rally after very short term correction

 Technical Analysis,Research & Weekly Outlook 
(Jan 30 to Feb 03, 2012)
Nifty-EOD Chart(27-Jan-2012):-
Just click on chart for its enlarged view
Averages are as follows:

200-Day EMA is at-5131
200-Day SMA is at-5202

Conclusions

Short and Intermediate term trends are up and long term trend turning up confirmation will be after  sustaining above 200-Day EMA as well as 200-Day SMA. Last 2 sessions closing above 200-Day EMA and testing of 200-Day SMA on 27-01-2012.

Strong breathless rally seen in last one month but last confirmation for blasing rally is left through sustaining above 200-Day SMA because Nifty got stiff resistance at 200-Day SMA 3 times earlier.

Long term trend turning up final confirmation will be after sustaining above 200-Day SMA and should be watched firstly in next week.

Nifty-EOD Chart(27-Jan-2012):-

Technical Patterns and Formations in EOD charts

1- Begining of strong rally on 20-12-2011 from 4531.15.
2- Trend Reversal 113 Sessions sideways market between 4720-5229 is intact.
3- Trend Reversal Broadening Pattern at the bottom of 14 months correction is intact.
4- Falling Trendline Correction from 5399 and its upward cross over.
5- Testing of Falling trend line from 6336 and Nifty retraced 7 times earlier from this falling trendline.

Conclusions from EOD chart analysis 

Bullish pattrens are very much intact and Nifty is trading near the higher levels of these patterns. Testing of Falling trend line from 6336 and Nifty retraced 7 times earlier from this falling trendline. As sentiment is heated therefore therefore very short term correction is due now.

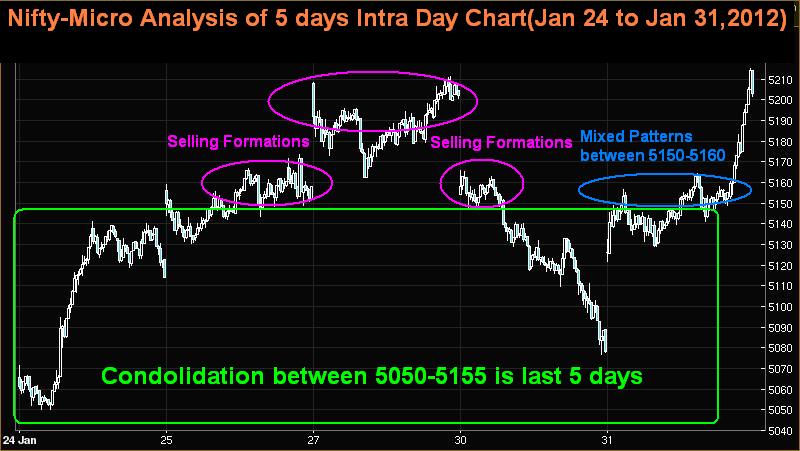
Nifty-Intra Day Chart(27-Jan-2012):-

Just click on chart for its enlarged view

Technical Patterns and Formations in today intraday charts

1- Support between 5163-5185
2- Selling Patterns between 5187-5194
3- Selling Patterns between 5200-5210
4- Up moves without force in rising channel.
5- Whole day trading between 5163-5210

Conclusions from intra day chart analysis 

Although closing near the top of the day after lower levels support but up moves have been without force as well as higher levels selling patterns also therefore view is cautions. Rally is on but correction is over due because short term indicators are heated and very short term correction may be seen for cooling down of overbought indicators.


Conclusions (After Putting All Studies Together)

Nifty tested following 2 crucial resistances on 27-Jan-2012;-

1- Testing of Falling trend line from 6336 and Nifty retraced 7 times earlier from this falling trendline.
2- Testing of 200-Day SMA and Nifty got stiff resistance at 200-Day SMA 3 times earlier.

Strong rally in 2012 and short term cotrrection will be seen only after complete distribution patterns and that has not beeen seen yet but very short term correction is due and that may be seen any day.

Although Nifty retraced several times from above mentioned levels but it does not mean that it will again happen. I posted following topic on 31-12-2011:-


I am Bullish from the very first day of 2012 and not expecting more than very short term correction and hoping that on going rally will remain continued after expected very short term correction.