ॐ ह्रीं श्रीं लक्ष्मीभयो नमः॥


Trading "calls" from our "Software" with more than "90% accuracy"

More than "12 years" old "only site of whole world" 
with more than "9700 accurate Outlooks" of 
"Indian Stock Markets" 
Watch Levels amid Parliamentary Election news led high volatility & Short to Intermediate Term correction beginning possibility
Technical Analysis,Research & Weekly Outlook
(Feb 12 to Feb 16,2024)
Nifty-EOD Chart Analysis
(Waves structure)
Nifty-EOD Chart (09-Feb-2024):-
Technical Patterns and Formations in EOD charts
 
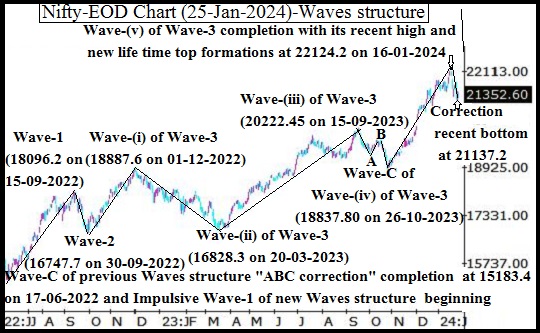
1- Corrective Wave-C of Wave-(iv) of Wave-3 completion at 18837.80 on 26-10-2023 and impulsive Wave-(v) of Wave-3 beginning. 
2- Impulsive Wave-(v) of Wave-3 continuation with its recent high and new life time top formations at 22126.80 on 02-02-2024.
3- Ascending Channel formations

Conclusions from EOD chart analysis
(Waves structure)

Impulsive Wave-(v) of Wave-3 started from 18837.80 on 26-10-2023 after corrective Wave-C of Wave-(iv) of Wave-3 completion at this level and now is in continuation with its recent high and new life time top formations at 22126.80 on 02-02-2024 as well as no confirmation of its completion yet on EOD charts. 

As per Elliott Wave theory maximum target of on going impulsive Wave-(v) of Wave-3) at 22231.95 was explained with its calculations in previous week weekly Outlook(Feb 05 to Feb 09,2024) in the topic named "Watch Levels amid maximum target of on going Wave at 22231.95". It was also told in this topic that on going Impulsive Wave-(v) of Wave-3 has gained 3289.00 till now and as per Elliott Wave theory it will not gain more than 3394.15 points which mean that now this wave can not gain more than 105.15 points(3394.15-3289.00). Although now Nifty is trading(Previous closing at 21,782.50) little below its maximum target(22231.95) and recent high(22126.80) but remain watchful and cautious because coming weeks and months may remain Parliamentary Elections news flow led highly volatile.

Now Nifty is moving within Ascending Channel. As its valid break out/down with generate first strong signal of next Trend formations and big moves beginning therefore it should also be watched in the coming weeks and months.  

Nifty-EOD Chart Analysis
(Stochastic & MACD)
Nifty-EOD Chart (09-Feb-2024):-
Technical Patterns and Formations in EOD charts

1- Last 7 Sessions actual trading between 21630-22126 
2- Stochastic- %K(5) line has intersected %D(3) line downward and its both lines are falling from Over bought zone.
3- Stochastic:- %K(5)- 35.17 & %D(3)- 46.94.
4- In MACD- MACD line has intersected Average line upward and its both lines are rising in positive and negative zone.
5- MACD(26,12)- 91.35 & EXP(9)- -24.75 & Divergence- 116.1

Conclusions from EOD chart analysis
(Stochastic & MACD)

Position of Short Term indicators are as follows:-

1- As in Stochastic indicator its both lines are falling from Over bought zone therefore it will be understood that this indicator is suggesting Short term down moves possibility.
2- As in MACD indicator MACD line has intersected Average line upward and its MACD line is rising in positive zone as well as its Average line is moving flat in negative zone therefore it will be understood that at present this indicator is showing minor signal of upward Short Term Trend formations but not confirming.

Nifty-EOD Chart Analysis
(Averages)
Nifty-EOD Chart (09-Feb-2024):-
Technical Patterns and Formations in EOD charts

Averages:-

1- 5-Day SMA is today at 21826
2- 21-Day SMA is today at 21696
3- 55-Day SMA is today at 21299
4- 100-Day SMA is today at 20510
5- 200-Day SMA is today at 19777

Conclusions from EOD chart analysis
(Averages)

As Nifty is well above Long and Intermediate Term Trend decider(200 and 55-Day SMA) therefore these 2 Trend are up but its Short Term Trend is at stake because Nifty is hovering around its deciders(5 and 21-Day SMA) therefore firstly sustaining beyond 21696-21826 should be watched in the coming week for Short Term Trend formation confirmations.  

Nifty-Last 7 Sessions
intraday charts analysis
Nifty-Intra Day Chart (Feb 01 to Feb 09,2024):-
Technical Patterns formation in last 7 Sessions intraday charts

1- Selling(Resistances) in last 7 Sessions are as follows:-
A- 21716-21818
B- 21947-22018
C- 22029-22126
2- Consolidation(Supports) in last 7 Sessions are as follows:-
A- 21711-21769
B- 21666-21741`
C- 21630-21665 
3- Last 7 Sessions actual trading between 21630-22126 

Conclusions from 7 Sessions
intra day chart analysis 

As both higher levels selling and lower levels consolidation patterns formations in the last 7 sessions therefore expected that Nifty will firstly trade and prepare for next Trend and big moves within last  7 Sessions trading range in the coming week. As finally sustaining beyond last 7 Sessions trading range will confirm next big moves beginning therefore it should also be watched in next week for its confirmations.

Nifty-Intra Day Chart Analysis
(09-Feb-2024)
Nifty-Intra Day Chart (09-Feb-2024):-
Technical Patterns formation in today intraday charts

1- 149 Points volatility in first hour between 21630-21779
2- Down moves in Bullish Falling Channels
3- Sharp up
4- Consolidation between 21711-21769 
5- Up moves in Bearish Rising Channel in last hours
6- Whole day actual trading between 21630-21804

Conclusions from intra day
chart analysis 

Although flat opening last Friday but firstly 149 Points volatility in first hour last Friday and after that consolidation was seen through  Down moves in Bullish Falling Channels therefore sharp up moves developed after 2 hours. As good consolidation in Mid session therefore up moves remained continued till last hslf hour but these up moves were in Bearish Rising Channel which is a selling pattern therefore higer levels selling will also be understood despite Nifty closing in Green with 0.30% gains.

As both consolidation and selling has patterns developed last Friday and one sided intraday trading patterns were not seen therefore expected that Nifty will firstly trade and prepare for next decisive moves within last Friday trading range in the beginning of next week. Let Nifty to trade and prepare then will be decided according to coming sessions intraday charts formations as well as finally sustaining beyond or forceful break out/down of 21630-21804 will confirm next decisive moves beginning which should also be watched in the next week for its confirmations.

Conclusions (After putting
all studies together)

1- Long Term trend is up.
2- Intermediate Term trend is up.
3- Short Term Trend at stake.

Although impulsive Wave-(v) of Wave-3 is now in continuation and no confirmation of its completion yet on EOD charts but remain cautious because EOD and intraday selling patterns formations were seen in previous sessions charts as well as as per Elliott Wave theory maximum target of on going impulsive Wave-(v) of Wave-3) is at 22231.95 which is only 105.15 points above the highest of on going Wave-(v) of Wave-3(22126.80). 

As above posted resistances of last 7 sessions are last trading resistances(22126) of Nifty therefore once sustaining above last resistances will mean fresh strong rally beginning above life time highest. Next immediate supports below last 7 sessions lowest(21630) are as follows:-

1- 21468-21571
2- 21248-21311
3- 21193-21263
4- 21078-21154
5- 20770-20852

Although indicators are not showing any side bigger decisive beginning indication but selling patterns have been seen in previous sessions EOD and intraday charts therefore Short to Intermediate Term correction may be seen in the coming weeks/months. As Parliamentary Election results are less than 100 away and till then election results news led high volatility may also be seen till Election results announcements as well as selling patterns have also been developed in previous weeks therefore following patterns and levels should be watched for next trend formation confirmations:-

1- Valid break out of "Ascending Channel"
2- Valid break out of last 7 sessions trading range(21630-22126)
3- Sustaining beyond above mentioned supports and resistances of last 7 sessions trading range(21630-22126) one by one.
Finally down moves expectations
 towards next supports
Nifty-Intra Day Chart Analysis & 
Market Outlook(09-02-2024)
Nifty-Intra Day Chart (08-Feb-2024):-
Technical Patterns formation in today intraday charts

1- Selling between 21947-22011
2- Sharp falls
3- Selling between 21716-21818
4- Minor supports at lower levels in last hour between 21666-21716
5- Whole day actual trading between 21666-22011

Conclusions from intra day chart analysis 

Although positive opening but selling developed therefore sharp falls were seen. As more than 3 hours follow up selling in Mid-session also therefore some down moves were seen in last hours also.  

Minor supports at lower levels in last hour between 21666-21716 and Nifty closed within yesterday mentioned immediate supports range(21681-21736) at 21717.95 also today therefore expected that Nifty will firstly trade between 21666-21736 tomorrow. As higher levels good intraday selling was seen today therefore finally down moves are expected towards next supports(21470-21563) and sustaining it beyond should also be watched for next decisive moves beginning confirmations.
Watch levels for first strong signal & final confirmations of next trend formations with big moves beginning confirmations
Nifty-Intra Day Chart Analysis & 
Market Outlook(08-02-2024)
Nifty-Intra Day Chart (07-Feb-2024):-
Technical Patterns formation in today intraday charts

1- Down moves with upward corrections after 115 points positive opening
2- Up moves from intraday lower levels with downward corrections.
3- Whole day actual trading between 21861-22053

Conclusions from intra day chart analysis 

Although some up moves after 115 points positive opening but Down moves begun with upward corrections(selling pattern) and Nifty traded 69 points negative also in Mid-session. As last 3 hours up moves from intraday lower levels were with downward corrections(consolidation pattern) also therefore whole day today intraday trading will be understood with Mixed Patterns formation between 21861-22053. 
Following immediate supports and resistances were posted in last 2 sessions:-

1- 21681-21736(Immediate supports)
2- 22029-22126(Immediate resistances)

As one sided clear intraday trading patterns were not seen today therefore firstly sustaining beyond today trading range(21861-22053) should be watched tomorrow for first strong signal of next trend formations and finally sustaining beyond above mentioned next immediate supports and resistances should be watched tomorrow for next trend formations with big moves beginning confirmations.
More up moves expectations 
towards next resistances
Nifty-Intra Day Chart Analysis & 
Market Outlook(07-02-2024)
Nifty-Intra Day Chart (06-Feb-2024):-
Technical Patterns formation in today intraday charts

1- Down moves after weaker opening
2- 101 Points volatility in first hour between 21776-21876
3- Up moves with downward corrections 
4- Whole day actual trading between 21738-21951

Conclusions from intra day chart analysis 

Although firstly down moves after weaker opening but after that  101 Points volatility was also in first hour between 21776-21876. As most Asian markets were trading with good gains therefore up moves begun which remain continued till last minutes.
As more than last 5 hours up moves were with downward corrections which is consolidation pattern therefore more up moves are expected towards next resistances(22029-22126) and firstly sustaining it beyond should be watched tomorrow for next decisive moves beginning confirmations.
More down moves expectations
 towards next supports
Nifty-Intra Day Chart Analysis & 
Market Outlook(06-02-2024)
Nifty-Intra Day Chart (05-Feb-2024):-
Technical Patterns formation in today intraday charts

1- Almost 5 Hours selling between 21877-21964
2- Sharp fall in last hour
3- Whole day actual trading between 21727-21964

Conclusions from intra day chart analysis 

Live Proofs of our 100% accurate 
Nifty predictions & Analysis

Following lines were told on 03-02-2024 in "Watch Levels amid maximum target of on going Wave at 22231.95":-

firstly down moves below last Friday lowest(21805.55) is expected in the beginning of next week.

As was told 100% same happened and Nifty closed 82.10 points down today

As almost 5 Hours selling today therefore sharp fall was seen in last hour and more down moves towards following next supports are expected tomorrow also as well as firstly sustaining it beyond should be watched tomorrow for next decisive moves beginning confirmations:-

1- 21681-21736
2- 21643-21678
Watch Levels amid maximum target
 of on going Wave at 22231.95
Technical Analysis,Research & Weekly Outlook
(Feb 05 to Feb 09,2024)
Nifty-EOD Chart Analysis
(Waves structure)
Nifty-EOD Chart (02-Feb-2024):-
Technical Patterns and Formations in EOD charts

1- Corrective Wave-C of previous Waves structure "ABC correction" completion at 15183.40 on 17-06-2022 and Impulsive Wave-1 of new Waves structure beginning.
2- Impulsive Wave-1 completion at 18096.20 on 15-09-2022.
3- Corrective Wave-2 completion at 16747.70 on 30-09-2022.
4- Impulsive Wave-(i) of Wave-3 completion at 18887.60 on 01-12-2022.
5- Corrective Wave-(ii) of Wave-3 completion at 16828.30 on 20-03-2023.  
6- Impulsive Wave-(iii) of Wave-3 completion at 20222.45 on 15-09-2023 and Wave-A of "ABC" correction beginning.
7- Wave-A of Wave-(iv) of Wave-3 completion at 19333.60 on 04-10-2023.
8- Wave-B of Wave-(iv) of Wave-3 completion at 19849.80 on 17-10-2023.  
9- Corrective Wave-C of Wave-(iv) of Wave-3 completion at 18837.80 on 26-10-2023 and impulsive Wave-(v) of Wave-3 beginning. 
10- Impulsive Wave-(v) of Wave-3 continuation with its recent high and new life time top formations at 22126.80 on 02-02-2024.

Conclusions from EOD chart analysis
(Waves structure)

Impulsive Wave-1 of new Waves structure started from 15183.4 on 17-06-2022 after corrective Wave-C of "ABC correction" of previous Waves structure completion at this level. Now its Impulsive Wave-(v) of Wave-3 is in continuation with its recent high and new life time top formations at 22126.80 on 02-02-2024 as well as no confirmation of its completion yet on EOD charts. 
 
Nifty-EOD Chart Analysis
(Wave-(iii,iv & v) of Wave-3 structure)
Nifty-EOD Chart (02-Feb-2024):-
Technical Patterns and Formations in EOD charts

1- Corrective Wave-(ii) of Wave-3 completion at 16828.30 on 20-03-2023 and Impulsive Wave-(iii) of Wave-3 beginning from this level
2- Impulsive Wave-(iii) of Wave-3 completion at 20222.45 on 15-09-2023 and Wave-A of "ABC" correction beginning.
3- Impulsive Wave-(iii) of Wave-3 gained 3394.15 points(20222.45-16828.30)
4- Wave-A of Wave-(iv) of Wave-3 completion at 19333.60 on 04-10-2023.
5- Wave-B of Wave-(iv) of Wave-3 completion at 19849.80 on 17-10-2023.  
6- Corrective Wave-C of Wave-(iv) of Wave-3 completion at 18837.80 on 26-10-2023 and impulsive Wave-(v) of Wave-3 beginning. 
7- Impulsive Wave-(v) of Wave-3 continuation with its recent high and new life time top formations at 22126.80 on 02-02-2024.
8- Impulsive Wave-(v) of Wave-3 has gained 3289.00 points(22126.80-18837.80) till now.

Conclusions from EOD chart analysis
(iii,iv & v) of Wave-3 structure)

Although no confirmation of Wave-(v) of Wave-3 completion yet on EOD charts but remain cautious because as per Elliott Wave theory maximum target of on going impulsive Wave-(v) of Wave-3) is at 22231.95. Its calculations are as follows:-          

Impulsive Wave-i gained=2912.8 points(18096.2-15183.4)
Impulsive Wave-iii gained=3394.15 points(20222.45-16828.3)
Impulsive Wave-v has gained 3289.00 points till 02-02-2024(22126.80-18837.80)

As according to Elliott Wave theory Wave-5 can not gain more points than Wave-3 gained therefore on going impulsive Wave-5 will gain lesser points than 3394.15.

Impulsive Wave-5 started from 18837.80 on 26-10-2023 and it has to gain less than 3394.15 points therefore maximum target of on going impulsive Wave-3 is at 22231.95(18837.80+3394.15)

Nifty-EOD Chart Analysis
(Stochastic & MACD)
Nifty-EOD Chart (02-Feb-2024):-
Technical Patterns and Formations in EOD charts

1- Stochastic- Both lines are kissing just below Over bought zone.
2- Stochastic:- %K(5)- 74.93 & %D(3)- 76.18.
3- In MACD- MACD line has intersected Average line downward. Its MACD line is rising and Average line is falling in negative zone.
4- MACD(26,12)- -71.23 & EXP(9)- -30.89 & Divergence- -40.34

Conclusions from EOD chart analysis
(Stochastic & MACD)

Position of Short Term indicators are as follows:-

1- As in Stochastic indicator its both lines are kissing  just below Over bought zone therefore showing first signal of Short term down moves beginning 
2- As in MACD indicator MACD line has intersected Average line downward and its MACD line is rising and Average line is falling in negative zone therefore it will be understood that at present this indicator is not confirming Short Term Trend.

Nifty-Intra Day Chart Analysis
(02-Feb-2024)
Nifty-Intra Day Chart (02-Feb-2024):-
Technical Patterns formation in today intraday charts

1- 225 Points up in first 7 minutes after strong opening
2- Consolidation between 21911-21963
3- Sharp up
4- Selling between 22029-22126
5- Sharp down
6- Selling between 21822-21940
7- Whole day actual trading between 21806-22126

Conclusions from intra day chart analysis 

As growth oriented Interim Budget was presented on 1st Feb 2024 therefore next day firstly 225 Points up moves were seen in first 7 minutes after strong opening and after that almost 2 hours fresh consolidation developed hence new life time highest was formed after sharp up moves. 

Although new life time top formations last Friday but higher levels selling was seen in Mid-session therefore sharp down moves developed after that. As follow up selling in almost last 3 hours also therefore it will be understood that good intraday selling developed in last 4 hours last Friday therefore firstly down moves below last Friday lowest(21805.55) is expected in the beginning of next week.

Conclusions
(After putting all studies together)

1- Long Term trend is up.
2- Intermediate Term trend is up.
3- Short Term Trend up.

Although Impulsive Wave-(v) of Wave-3 continuation with its recent high and new life time top formations at 22126.80 on 02-02-2024 as well as no confirmation of its completion yet on EOD charts but remain cautious because:-

1- As per above given Elliott Wave theory calculations maximum target of on going impulsive Wave-3 at is 22231.95.
2- Long "Shooting Star" Bearish Candle formation on 01-02-2024 in which once Nifty retraced 321.25 points from intraday higher levels.

At present indicators are not showing clear signals of any side decisive moves beginning but intraday charts of last Friday are suggesting down moves in the beginning of next week therefore firstly following supports should be watched in the next week:-

1- 21681-21736
2- 21643-21678
3- 21470-21563
4- 21193-21311
 
Resistances of Nifty are as follows:-

1- 21822-21940
2- 22029-22126

As previous week up moves and new life time top formations was Interim Budget expectations and its announcements led as well as sharp fall from higher levels was seen last Friday also therefore finally sustaining beyond above mentioned supports and resistances should be watched in the coming weeks for post Interim Budget next trend formations amid maximum target of on going impulsive Wave-3 at is 22231.95.
Sustaining beyond 21659-21832
 will confirm post Budget decisive
 moves beginning
Nifty-Intra Day Chart (01-Feb-2024):-
Technical Patterns formation in today intraday charts

1- Most time sideways trading between 21681-21823
2- Whole day actual trading between 21659-21832

Conclusions from intra day chart analysis 

Although Interim Budget presentation today but Budget led no intraday volatility and most time sideways trading was seen between 21681-21823. As Indian Stock markets have prepared for post Budget decisive moves beginning within today sideways trading range therefore firstly it sustaining beyond should be watched tomorrow for its confirmation.
Firstly Watch sustaining beyond 21643-21775 for next Post Budget big moves amid high possibility of decisive down moves beginning 
Nifty-Intra Day Chart Analysis & 
Market Outlook(01-02-2024)
Nifty-Intra Day Chart (31-Jan-2024):-
Technical Patterns formation in today intraday charts

1- More than 12 hours trading in last 3 sessions between 21643-21775
2- Last 3 sessions between 21430-21813

Conclusions from intra day chart analysis 

As more than 12 hours trading in the last 3 Pre Interim Budget sessions was seen between 21430-21813 and Nifty has prepared for next decisive post Budget big moves within this range therefore finally sustaining beyond this range will confirm next big post Budget one sided big moves. Although Interim Budget led high volatility will be seen tomorrow but finally sustaining beyond 21643-21775 will confirm next big moves will be seen which should be firstly watched tomorrow. As good intraday selling was seen in last 3 sessions therefore high possibility of decisive down moves beginning below 21643. 
Some more down moves & finally sideways between 21311-21662 up to Interim Budget 2024
Nifty-Intra Day Chart Analysis & 
Market Outlook(31-01-2024)
Nifty-Intra Day Chart (30-Jan-2024):-
Technical Patterns formation in today intraday charts

1- More than 4 hours selling between 21662-21813
2- Down moves with upward corrections in last 2 hours
3- Whole day actual trading between 21502-21813

Conclusions from intra day chart analysis 

Live Proofs of our 100% accurate 
Nifty predictions & Analysis

Following lines were told at 12:02 AM on 30-01-2024 in "Up moves with bigger intraday corrections possibility":-

1- some more up moves also can not be ruled out tomorrow
2- bigger intraday corrections may also be seen tomorrow

As was told 100% same happened and

1- Some more up moves were seen & firstly Nifty traded 75 points up today
2- Bigger intraday corrections were also seen & Nifty closed 215 points also down today.

Although firstly Nifty traded 75 points up today but selling begun which remained continued in more than 4 hours and last 2 hours down moves were with upward corrections therefore Nifty closed near the lower levels of the day 215 points down.

As whole day only intraday selling patterns formations therefore some more down moves towards next supports(21248-21311) can not be ruled out but expected that finally will remain sideways between 21311-21662 up to Interim Budget 2024.
Up moves with bigger intraday
 corrections possibility
Nifty-Intra Day Chart Analysis & 
Market Outlook(30-01-2024)
Nifty-Intra Day Chart (29-Jan-2024):-
Technical Patterns formation in today intraday charts

1- Whole day up moves with downward corrections
2- Whole day actual trading between 21430-21763

Conclusions from intra day chart analysis 

Live Proofs of our 100% accurate 
Nifty predictions & Analysis


1- last Thursday started up moves will remain continued in the beginning of next week above day's Highest(21459)
2- up moves will be seen in the beginning of next week towards following next resistances

As was told 100% same happened and Nifty closed 385 points(1.80%) up today.
As those Up moves which started after positive opening and whole day remained continued with downward corrections therefore Nifty closed near the higher levels of the day. Although whole day only consolidation patterns formations and some more up moves also can not be ruled out tomorrrow but very Short term indicators have turned Over bought after previous sessions strong rally therefore bigger intraday corrections may also be seen tomorrow.
Correction continuation but firstly up moves expectations & Watch levels in Interim Budget led volatile week
Technical Analysis,Research & Weekly Outlook
(Jan 29 to Feb 02,2024)
Nifty-EOD Chart Analysis
(Waves structure)
Nifty-EOD Chart (25-Jan-2024):-
Technical Patterns and Formations in EOD charts

1- Corrective Wave-C of previous Waves structure "ABC correction" completion at 15183.4 on 17-06-2022 and Impulsive Wave-1 of new Waves structure beginning.
2- Impulsive Wave-1 completion at 18096.2 on 15-09-2022.
3- Corrective Wave-2 completion at 16747.7 on 30-09-2022.
4- Impulsive Wave-(i) of Wave-3 completion at 18887.6 on 01-12-2022.
5- Corrective Wave-(ii) of Wave-3 completion at 16828.3 on 20-03-2023.  
6- Impulsive Wave-(iii) of Wave-3 completion at 20222.45 on 15-09-2023 and Wave-A of "ABC" correction beginning.
7- Wave-A of Wave-(iv) of Wave-3 completion at 19333.6 on 04-10-2023.
8- Wave-B of Wave-(iv) of Wave-3 completion at 19849.8 on 17-10-2023.  
9- Corrective Wave-C of Wave-(iv) of Wave-3 completion at 18837.80 on 26-10-2023 and impulsive Wave-(v) of Wave-3 beginning. 
10- Impulsive Wave-(v) of Wave-3 completion with its recent high and new life time top formations at 22124.2 on 16-01-2024.
11- Short Term correction continuation with recent bottom formation at 21137.2 on 24-01-2024. 

Conclusions from EOD chart analysis
(Waves structure)

Corrective Wave-C of "ABC correction" of previous Waves structure completion at 15183.4 on 17-06-2022 and from this level Impulsive Wave-1 of new Waves structure begun. Impulsive Wave-(v) of Wave-3 of this Waves structure completed with its recent high and new life time top formations at 22124.2 on 16-01-2024. Correction begun  from life time top which is in continuation with its recent bottom formation at 21137.2 on 24-01-2024 and no confirmation of its completion yet on EOD and intraday charts. 

Nifty-EOD Chart Analysis
(Stochastic & MACD)
Nifty-EOD Chart (25-Jan-2024):-
Technical Patterns and Formations in EOD charts

1- Stochastic- Both lines are kissing just above Over sold zone.
2- Stochastic:- %K(5)- 31.27 & %D(3)- 29.77.
3- In MACD- MACD line has intersected Average line downward and its both lines are falling in negative and positive zone.
4- MACD(26,12)- -19.27 & EXP(9)- 108.21 & Divergence- -127.48

Conclusions from EOD chart analysis
(Stochastic & MACD)

Position of Short Term indicators are as follows:-

1- As in Stochastic indicator its both lines are kissing just above Over sold zone therefore showing first signal of Short term up moves beginning 
2- As in MACD indicator MACD line has intersected Average line downward and its both lines are falling in negative and positive zone therefore it will be understood that this indicator is confirming Short Term Trend turning downward and on going correction continuation possibility also.

Nifty-EOD Chart Analysis
(Averages)
Nifty-EOD Chart (25-Jan-2024):-
Technical Patterns and Formations in EOD charts

Averages:-

1- 5-Day SMA is today at 21447 
2- 21-Day SMA is today at 21639 
3- 55-Day SMA is today at 20902
4- 100-Day SMA is today at 20311
5- 200-Day SMA is today at 19573
 
Conclusions from EOD chart analysis
(Averages)

As Nifty is closing below Short Term Trend decider 5 and 21-Day SMA for the last 7 sessions therefore  Short Term Trend is confirmed downward. Intermediate Term Trend decider 55-Day SMA is today at 20902 which is little above recent bottom of Nifty(21137.20) and Sustaining it beyond should be firstly  watched in the coming week/weeks for Intermediate Term Trend formation confirmations because once its downward confirmations will mean more Down moves for the next 3 weeks to 3 months. Now Nifty is well above Long Term Trend decider 200-Day SMA therefore at present Long Term Trend is up,

Nifty-Intra Day Chart Analysis
(25-Jan-2024)
Nifty-Intra Day Chart (25-Jan-2024):-
Technical Patterns formation in today intraday charts

1- 211 Points fall in first 2 hours after flat opening.
2- Consolidation between 21248-21311
3- 134 Points sharp up moves in last half hour. 
4- Whole day actual trading between 21248-21459

Conclusions from intra day chart analysis 

Although flat opening but firstly 211 points fall was seen in first 2 hours last Thursday. As lower levels more than 3 hours consolidation therefore sharp up moves developed in last half hour. Expected that last Thursday started up moves will remain continued in the beginning of next week above day's Highest(21459). 

Conclusions
(After putting all studies together)

1- Long Term trend is up.
2- Intermediate Term trend is up.
3- Short Term Trend down.

Impulsive Wave-(v) of Wave-3 completed after life time top formations at 22124.2 on 16-01-2024 and Short Term correction begun from this level which is in continuation with recent bottom formation at 21137.2 on 24-01-2024 and no confirmation of its completion yet. 

Although MACD indicator is confirming Downward Trend formations but Stochastic indicator is signalling up moves beginning possibility. As intraday charts of last Thursday are showing lower levels good intraday consolidation therefore up moves will be seen in the beginning of next week towards following next resistances:-

1- 21535-21562
2- 21631-21689
3- 21852-21969(Gap Resistance)
4- 22034-22055
5- 22079-22124

Interim Budget-2024 will be tabled in the Parliament on 01-02-2024 and Indian Stock markets are in correction mode therefore Nifty will be highly volatile hence following supports should also be watched in next week for the life and length of on going correction:-

1- 21248-21311
2- 21193-21263
3- 21078-21154
4- 20770-20852
 
Although correction continuation but firstly up moves is expected in the coming week. As Interim Budget led volatilitily will also be seen in next week therefore above mentioned supports and resistances should also be watched for next immediate moves beginning confirmations.

Up moves expectations towards 
next resistances
Nifty-Intra Day Chart Analysis & 
Market Outlook(25-01-2024)
Nifty-Intra Day Chart (24-Jan-2024):-
Technical Patterns formation in today intraday charts

1- 101 Points down in first 5 minutes after weaker opening
2- Up moves with downward corrections
3- Mixed Patterns formation between 21304-21407
4- Consolidation between 21211-21335 
5- Up moves with downward corrections
6- Whole day actual trading between 21138-21482

Conclusions from intra day chart analysis 

Although 101 Points down in first 5 minutes after weaker opening but Nifty moved up 257 points in first hour from lower levels and traded 156 points up also. As trading with Mixed Patterns formations after Up moves with downward corrections therefore little down moves were seen but good consolidation developed in Mid-session hence up moves started which remained continued till last minutes. 

As last 2 hours up moves were with downward corrections and good intraday consolidation at lower levels also therefore today closing was more than 1% up. Most time intraday consolidation today therefore up moves are expected towards next resistances(21535-21562) in the coming sessions.

Firstly watch 21193-21263 for next intraday decisive moves beginning confirmations amid some up moves expectations
Nifty-Intra Day Chart Analysis & 
Market Outlook(24-01-2024)
Nifty-Intra Day Chart (23-Jan-2024):-
Technical Patterns formation in today intraday charts

1- More than 5 hours Down moves with upward corrections after 144 points up strong opening.
2- Supports between 21193-21263
3- Whole day actual trading between 21193-21750

Conclusions from intra day chart analysis 

Although Nifty traded 178 points up in first 2 minutes after 144 Points strong opening but selling was seen through Down moves with upward corrections which remained continued in the next 5 hours. As supports was also seen between 21193-21263 in last hour and Very Short Term indicators have also turned Oversold therefore some up moves are expected tomorrow. Firstly sustaining beyond today supports range(21193-21263) should be watched tomorrow for next intraday decisive moves beginning confirmations. 
Finally correction continuation below 
18801 in the coming months
Technical Analysis,Research & Weekly Outlook
(Jan 23 to Jan 25,2024)
Nifty-EOD Chart Analysis
(Waves structure)
Nifty-EOD Chart (19-Jan-2024):-
Technical Patterns and Formations in EOD charts

1- Corrective Wave-C of previous Waves structure "ABC correction" completion at 15183.4 on 17-06-2022 and Impulsive Wave-1 of new Waves structure beginning.
2- Impulsive Wave-1 completion at 18096.2 on 15-09-2022.
3- Corrective Wave-2 completion at 16747.7 on 30-09-2022.
4- Impulsive Wave-(i) of Wave-3 completion at 18887.6 on 01-12-2022.
5- Corrective Wave-(ii) of Wave-3 completion at 16828.3 on 20-03-2023.  
6- Impulsive Wave-(iii) of Wave-3 completion at 20222.45 on 15-09-2023 and Wave-A of "ABC" correction beginning.
7- Wave-A of Wave-(iv) of Wave-3 completion at 19333.6 on 04-10-2023.
8- Wave-B of Wave-(iv) of Wave-3 completion at 19849.8 on 17-10-2023.  
9- Corrective Wave-C of Wave-(iv) of Wave-3 completion at 18837.80 on 26-10-2023 and impulsive Wave-(v) of Wave-3 beginning. 
10- Impulsive Wave-(v) of Wave-3 continuation with its recent high and new life time top formations at 22124.2 on 16-01-2024.
11- Short Term correction continuation with recent bottm formation at 21539.4 on 18-01-2024. 

Conclusions from EOD chart analysis
(Waves structure)

Impulsive Wave-1 of new Waves structure begun from 15183.4 on 17-06-2022 after corrective Wave-C of "ABC correction" of previous Waves structure completion at this level. Now its Impulsive Wave-(v) of Wave-3 is in continuation with its recent high and new life time top formations at 22124.2 on 16-01-2024. 

Although no confirmation of on going Wave-(v) of Wave-3 completion yet on EOD charts but Bearish Rising Wedge Pattern formation was seen and Short Term correction begun in previous week which is in continuation  with recent bottom formation at 21539.4 on 18-01-2024 as well as rising Lower line of Bearish Rising Wedge was broken down on 18-01-2024

Nifty-EOD Chart Analysis
(Stochastic & MACD)
Nifty-EOD Chart (19-Jan-2024):-
Technical Patterns and Formations in EOD charts

1- Rising Lower line of Bearish Rising Wedge Pattern broken down on 18-01-2024
2- Stochastic- %K(5) line has intersected %D(3) line downward and its both lines are falling towards Over sold zone.
3- Stochastic:- %K(5)- 21.66 & %D(3)- 40.40.
4- In MACD- MACD line has intersected Average line downward and its both lines are falling in positive zone.
5- MACD(26,12)- 115.81 & EXP(9)- 180.68 & Divergence- -64.87

Conclusions from EOD chart analysis
(Stochastic & MACD)

Position of Short Term indicators are as follows:-

1- As in Stochastic indicator %K(5) line has intersected %D(3) line downward and its both lines are falling towards Over sold zone and Short Term Trend has not turned Oversold yet therefore it will be understood that this indicator is signalling some more down moves possibility in the coming week.  
2- As in MACD indicator MACD line has intersected Average line downward and its both lines are falling in positive zone therefore it will be understood that this indicator is signalling down moves continuation with Short Term Trend turning downward possibility also.

Nifty-EOD Chart Analysis
(Averages)
Nifty-EOD Chart (19-Jan-2024):-
Technical Patterns and Formations in EOD charts

Averages:-

1- 5-Day SMA is today at 21757
2- 21-Day SMA is today at 21643
3- 55-Day SMA is today at 20749
4- 100-Day SMA is today at 20228
5- 200-Day SMA is today at 19494
 
Conclusions from EOD chart analysis
(Averages)

As Nifty is hovering about Short Term Trends decider 21-Day SMA for the last 3 sessions therefore Short Term Trend is at stake. Let Nifty to sustain one side then Short Term Trend will be decided accordingly. Nifty is well above Intermediate Term Trends decider 55-Day SMA and Long Term Trends decider 200-Day SMA hence both these Trends are up,

Nifty-EOD Chart Analysis
(Fibonacci retracement levels)
Nifty-EOD Chart (19-Jan-2024):-
Technical Patterns and Formations in EOD charts

1- Impulsive Wave-(i) of Wave-3 started from 16747.7 on 30-09-2022
2- Impulsive Wave-(v) of Wave-3 completion expectations at 22124.2 on 16-01-2024.
3- Fibonacci Retracement levels from Wave-(i) of Wave-3 to Wave-(v) of Wave-3(16747.7-22124.2)
13.0%- 21,425 
23.6%- 20,855 
27.0%- 20,672 
38.2%- 20,070(Crucial Level)
50.0%- 19,436(Crucial Level)
61.8%- 18,801(Crucial Level)
70.7%- 18,323
76.4%- 18,016
78.6%- 17,898
88.6%- 17,360

Conclusions from EOD chart analysis
(Fibonacci retracement levels)

Previous week started correction was of Wave-(v) of Wave-3. As this correction is of Wave-(v) therefore once correction beginning confirmation will mean it will correct 5376.5 points up moves of  Wave-3 which started from 16747.7 and completed at 22124.2.  Fibonacci retracement levels have been posted above which should be watched after expected correction continuation confirmations. 

Conclusions
(After putting all studies together)

1- Long Term trend is up.
2- Intermediate Term trend is up.
3- Short Term Trend is at stake and its turning downward confirmations will be after sustaining below its decider 21-Day SMA which is today at 21643.

As per Elliott Wave theory maximum target of On going impulsive Wave-(v) of Wave-3) is at 22231.95. Its calculations are as follows:-

Impulsive Wave-i gained=2912.8 points(18096.2-15183.4)
Impulsive Wave-iii gained=3394.15 points(20222.45-16828.3)
Impulsive Wave-v has gained 1453.75 points till 01-12-2023(20291.55-18837.80)

As according to Elliott Wave theory Wave-5 can not gain more points than Wave-3 gained therefore on going impulsive Wave-5 will gain lesser points than 3394.15.

Impulsive Wave-5 started from 18837.80 on 26-10-2023 and it has to gain less than 3394.15 points therefore maximum target of on going impulsive Wave-5 is 22231.95(18837.80+3394.15)

As per on going Elliott Waves structure maximum target of On going impulsive Wave-(v) of Wave-3) is at 22231.95 and correction of Wave-(v) of Wave-3 begun just below it from 22124.2 on 16-01-2024 in following manner in previous week:- 

1- Long "Shooting Star" Bearish Candle formation on 17-01-2024 in which once Nifty retraced 482 points and closed 461 points down on that day.
2- Nifty retraced 838 points in only 3 sessions between 17-01-2024 and 17-01-2024
3- Bearish Rising Wedge Pattern formation was being seen and its rising Lower line was broken down on 18-01-2024 as well as Nifty is hovering around it for the last 3 sessions.

On going Wave-3 has gained 5376.5 points till now during its up moves from 16747.7 to 22124.2. As Nifty has to correct Wave-3 up moves in which most likely Nifty will retrace all the 3286.4 points gains of Wave-(v) of Wave-3(From 18837.80 to 22124.2). It means that Nifty will slip below 18837.80 during expected correction which is just above 61.8%(18801) Crucial Fibonacci retracement level also.

Expected that Nifty will slip below 18801 during previous week started correction and Long Term Trend will also turn down because its decider 200-Day SMA is today at 19494 which is much above  61.8%(18801) Fibonacci retracement level.

As indicators are also suggesting some more down moves possibility in Short Term therefore on going correction continuation is expected in the coming week also. Although Pull Back rallies and Bounce backs will also be seen but Nifty will not move above 22231.95 before and after Interim Budget as well as expected that finally previous week started correction will remain continued below 18801 in the coming months.
 As out of station therefore unable 
to post tomorrow(19-01-2024) Outlook. 
Sustaining beyond 21501-21604 will confirm next intraday decisive move beginning
Nifty-Intra Day Chart Analysis & 
Market Outlook(18-01-2024)
Nifty-Intra Day Chart (17-Jan-2024):-
Technical Patterns formation in today intraday charts

1- Down moves with upward corrections
2- Selling between 21631-21689
3- Minor support in last hour between 21551-21604
4- Whole day actual trading between 21551-21851

Conclusions from intra day chart analysis 

Live Proofs of our 100% accurate 
Nifty predictions & Analysis

1- Although new life time top formation on 16-01-2024 but intraday charts had shown only selling patterns therefore we were Bearish and posted following topic on 16-01-2024:-


2- Although Nifty closed with 203 points gains with new life time top formation on 15-01-2024 but intraday selling was also seen therefore we were not Bullish and posted following topic on 15-01-2024:-


3- Although Nifty closed with 247 points gains with new life time top formation last Friday(12-01-2024) but EOD charts were showing selling patterns therefore we were not Bullish and Cautious as well as posted following Weekly Analysis topic on 13-01-2024:-


As was continuously told in previous Outlooks 100% same happened today and Nifty closed after loosing 460.35(2.09%) points today.

Although Nifty moved up 205 points in first 6 minutes after 385 points weaker opening but selling was seen in first 3 hours through Down moves with upward corrections and after that selling in Mid-Session between 21631-21689 therefore down moves remained continued till last hour, 

As minor support was seen in last hour between 21551-21604 and previous supports are also lying between 21501-21542 therefore firstly sustaining beyond 21501-21604 should be watched tomorrow for next intraday decisive move beginning confirmations.
Down moves below today lowest
Nifty-Intra Day Chart Analysis & 
Market Outlook(17-01-2024)
Nifty-Intra Day Chart (16-Jan-2024):-
Technical Patterns formation in today intraday charts

1- Selling between 22079-22124
2- Down moves
3- Selling between 22034-22055
4- Whole day actual trading between 21970-22124

Conclusions from intra day chart analysis 

Although firstly some up moves after little weaker opening and new life time formation also but fresh selling developed therefore down moves were seen in Mid-session. As follow up selling was also seen in last hours therefore most time intraday selling will be understood for today and resultant down moves will be seen below today lowest(21969.80) in the coming sessions.
 Firstly watch sustaining beyond 
21964-22115 for next decisive 
moves beginning confirmations
Nifty-Intra Day Chart Analysis & Market 
Outlook(16-01-2024)
Nifty-Intra Day Chart (15-Jan-2024):-
Technical Patterns formation in today intraday charts

1- 116 Points fall from intraday higher levels in first hour
2- Up moves in Bearish Rising Channel
3- More than 3 hours trading with mixed Patterns formation between 22027-22082
4- Up moves with downward corrections in last hour
5- Whole day actual trading between 21964-22115

Conclusions from intra day chart analysis 

Although gap up strong opening above 22000 but 116 Points fall was seen in first hour from intraday higher levels. As after that up moves were in Bearish Rising Channel and more than 3 hours trading was with mixed Patterns formation between 22027-22082 as well as up moves were with downward corrections in last hour which is a consolidation pattern also therefore whole day today trading will be understood with intraday mixed Patterns formations.

As one sided intraday trading patterns were not seen today and both consolidation and selling patterns were seen therefore expected that Nifty will firstly traded and prepare for next decisive moves within and near about today trading range as well as finally sustaining beyond today trading range(21964-22115) will confirm it hence it should be firstly watched tomorrow.